
It's a rough day for all risk assets but the pound has been particularly hard hit, lagging risk assets badly.
Some of that might be a catch-up trade after it found some strength earlier in the week around the Boris Johnson drama but it's re-correlated with stocks. That correlation was one of the stronger ones in the world throughout most of the year so with the Nasdaq down 3.2%, it's not a surprise to see it return.
That trend is running head-long into the dominant theme in G10 FX this year: Yen weakness.
The Bank of Japan alone has retained ultra-loose monetary policy and isn't showing any sign of giving up yield curve control yet. That dam will eventually burst but it hasn't yet. With the mood so sour, the yen is keeping pace with the dollar today.
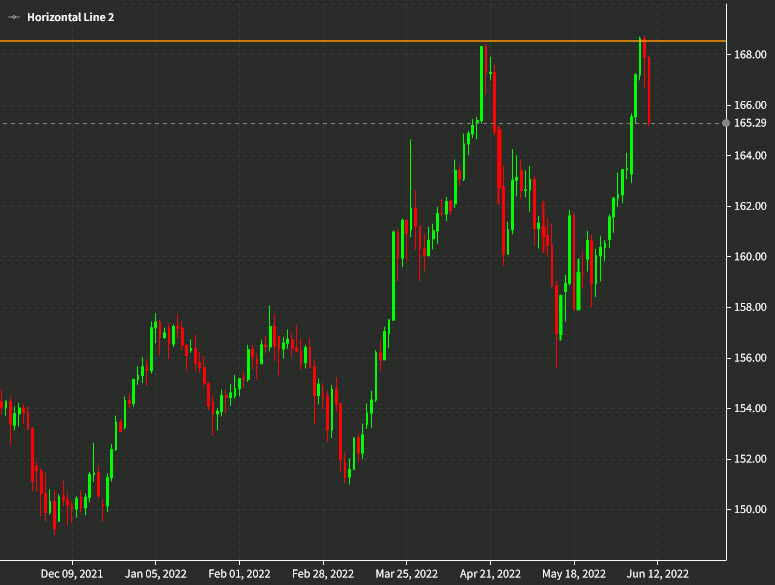
That's made for an interesting GBP/JPY chart. The pair touched the highest since 2016 this week, but only marginally. It's since sank back below the April low and is down 254 pips today to 165.30.
As the odds of a recession grow in Europe and a the odds of BOJ pivot mount, this is an interesting pattern and one worth watching closely.

