What key levels to eye
Upside.
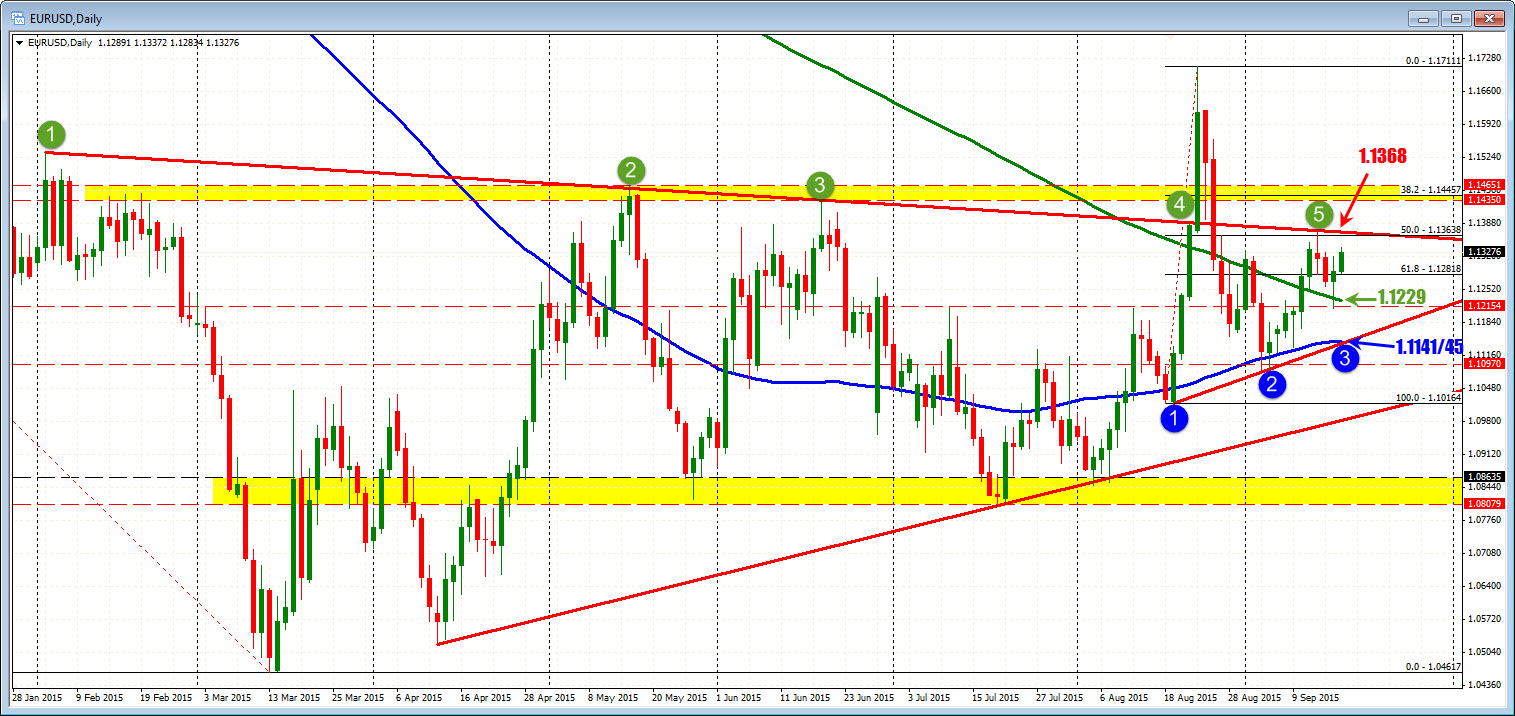
1.1368: This is the old trend line which was tested earlier in the week and held (daily chart).
1.1398: 50% of the move down from the Dow down 1000 point day.
1.1435-65: Swing highs in Feb. Swing highs in May. Swing high in June.
1.1533: High from Feb 3rd
Downside.
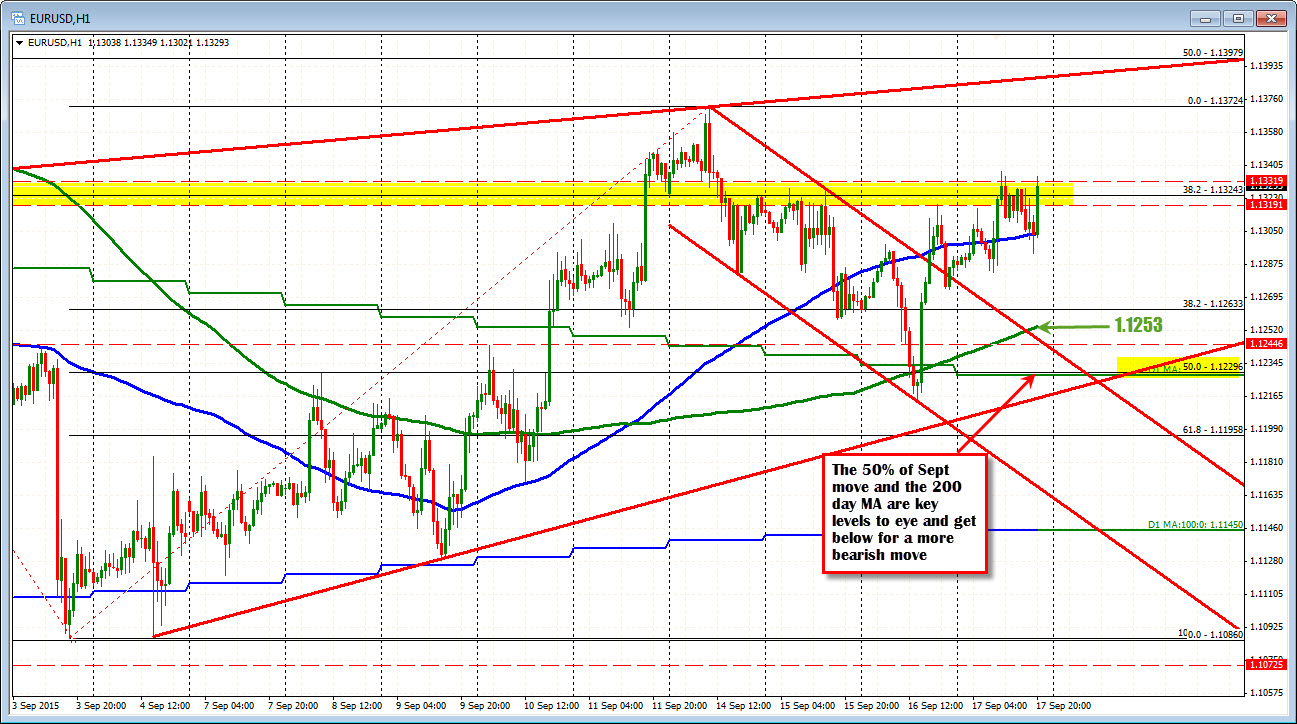
1.1263: 38.2% of the September move higher
1.1253: 200 hour MA
1.1229 - 200 day MA and 50% of the September range
1.1213-15: High from July, High from August 12 and low from yesterday's trade.
1.1141-45 - Trend line and 100 day MA