Low demand, oversupply of commodities and too many ships lead to plunging prices
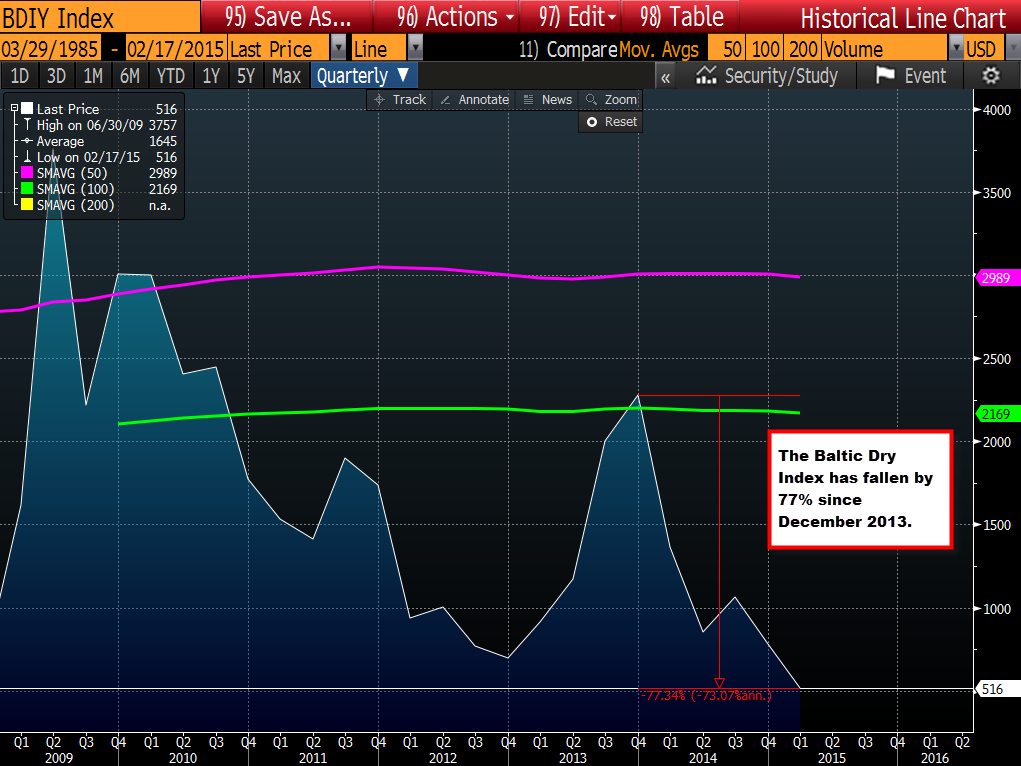
The Baltic Dry index is a measure of the cost to move major raw materials by sea. The index has been slumping dramatically since peaking last in December 2013. At that time the index stood at 2277. The current level of 516 represents a 77% plunge (see chart below). That plunge has led to recent bankruptcy filings by shippers (there have been two bankruptcies in February alone according to Reuters), and the idling of ships as supply exceeds demand for shipped goods.
The index slump is due to a combination of factors.
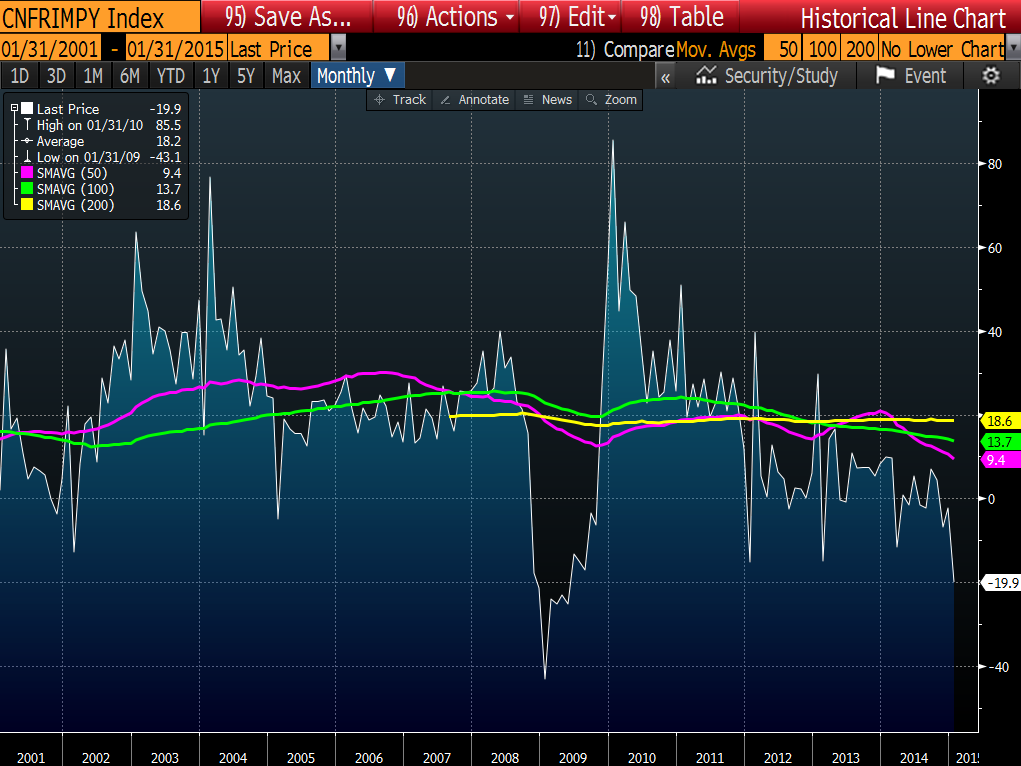
- Slowing global growth/China growth- In the most recent data, China imports YoY are down -19.9% from a year earlier (see chart below). This represents the largest YoY decline since May 2009. China GDP in 2014 was the lowest since 1990. Moreover, both China and global growth are expected to be weaker than prior estimates in 2015 and 2016. The IMF is expecting that China will grow by 6.8% and 6.3% over the next two years. It sounds like a healthy pace, but relatively speaking, it is not good news. Those estimates are down from 7.1% and 6.8% respectively. For global growth, the estimate is for 3.5% and 3.7% in 2015 and 2016 respectively, down from prior estimates of 3.8% and 4% respectively (from October 2014). .
2. Oversupply of new ships. The expected supply of ships is expected to increase by 39% in the next 3 years according to Clarkson, a global shipping company. The building of a ship is not something that can be started and stopped. Once it is contracted, a few years later it becomes a part of the fleet. Ship builders overestimated the demand for goods from China, and as a result, are starting to pay the price.
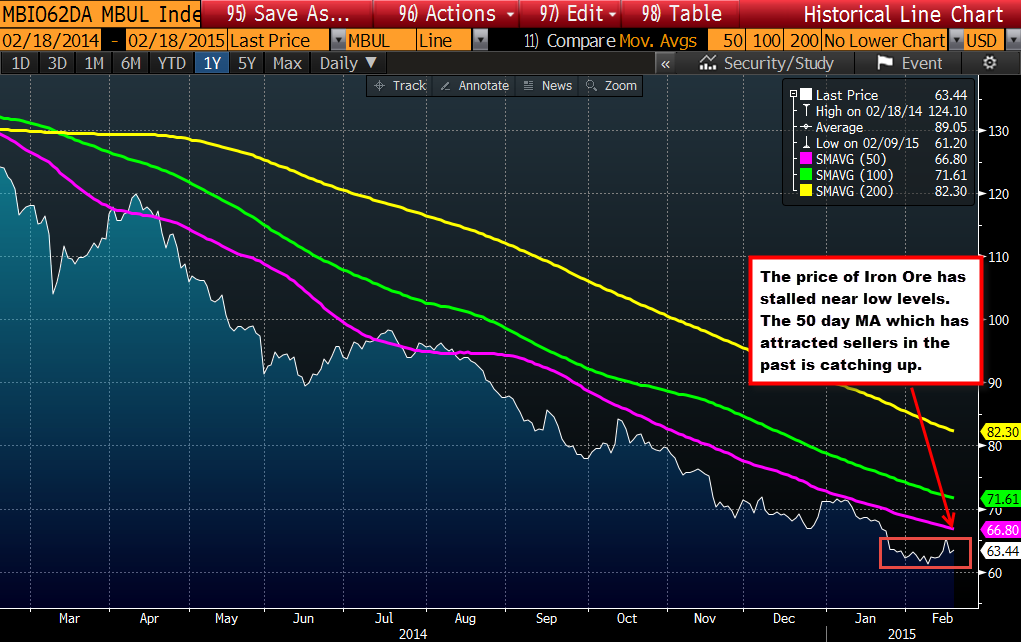
The way for the Baltic Dry index to go higher is by more demand or by taking ships offline. Since the supply of ships is the last thing to go, simply because of the immense carry cost of an idle ship, the wiggle is from the demand. If the demand is not there for goods (and you can see that in the price graph of iron ore - see chart below - and the GDP estimates), the Baltic index is likely to remain depressed.