Can't keep the Bitcoin down
Yesterday, the price of bitcoin moved to new highs, and in the process, respected the 100 and 200 bar MAs on the 5-minute chart. Here is the chart from yesterday's post:

Note the support found against the MA lines (100 bar blue line and 200 bar green bar).
I warned in that post:
"We have come off the highs over the last hour or so, and retests the rising 100 bar MA (blue line at 8180.55). That line is a short term trading barometer for buyers and sellers. Stay above (so far it is doing that), is bullish. Move below the MA line, and it the buyers might become a little more cautious. The 200 bar MA at 8097.17 will be eyed as the next target (on the downside)."
So what happened?
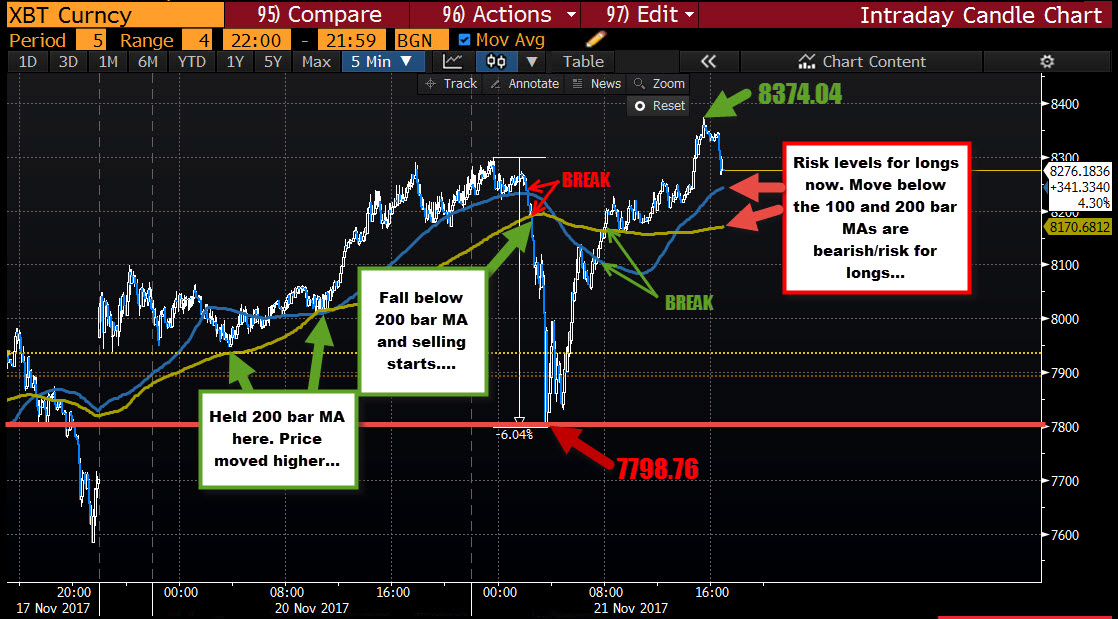
Looking at the 5-minute chart today (see chart below), the 100 bar MA blue line) was broken in the Asian session, and then the 200 bar MA (green line) was also broken. From that break, the price tumbled from around 8200 to about 7800. The fall from the high was 6%. That is a material move. However, the technical tools gave a warning of the potential for a fall and when the MAs were busted the selling began.
So what happened after the fall?
The price did rebound (true to the bitcoin pattern) and when the 100 and 200 bar MA were rebroken - this time back to the upside - a new all time high was eventually made at $8374.04.
What we know by now is the journeys in the crytocurrency continue to be wild rides with big swings. Last week, the fall from a peak went nearly 30% lower before recouping all the gains.
The thing is, we really do not know how far lows will go.
So if trading this instrument with any sort of account size, be sure to monitor the technicals. They do help to tell the story (or at least warn of an oncoming bearish storm) that can be 6% or 30%. I would rather know, and be able to protect (and perhaps even profit on a short position).
What next?
Well the 100 bar MA (blue line) is at $8250. Stay above, more bullish. The sky is the limit. However, move below it, the bias is more bearish. If the 200 bar MA (green line) at 8170.68 is also broken, that is even more bearish. How far it goes, nobody really knows.
However there are some targets traders can look toward.
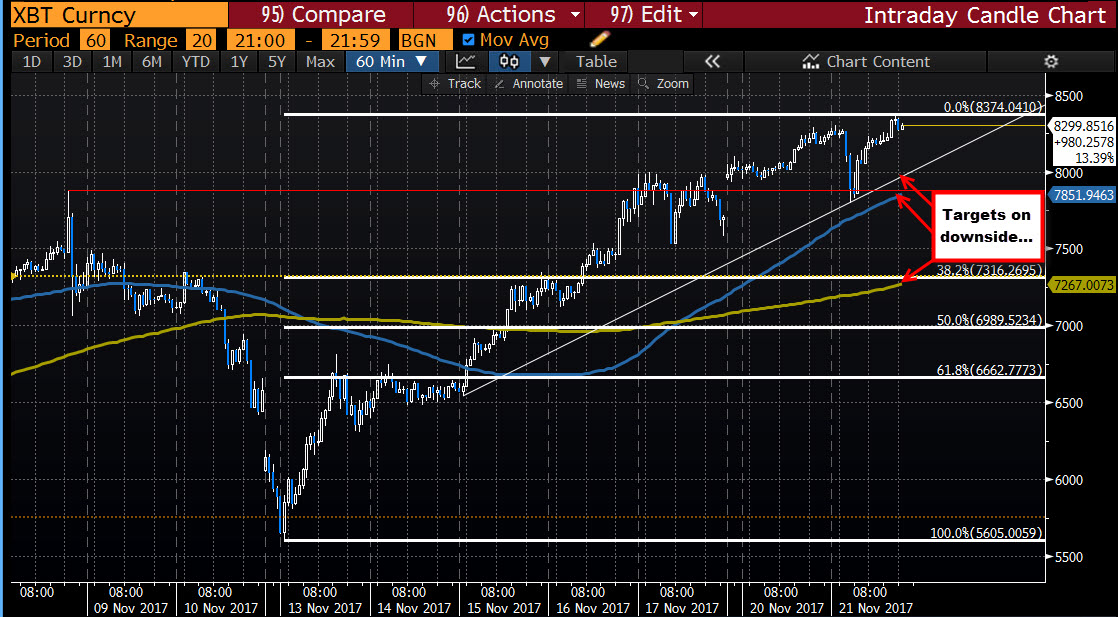
Looking at the hourly chart, some targets to eye on more bearish move would include:
- 7981. That is the trend line on the chart below (and moving higher)
- 100 hour MA at 7851.91 (blue line and moving higher)
- 38.2% at 7316.26
- 200 hour MA at 7266.98 (green line and moving higher)
A break below those levels and look for even more downside momentum.