
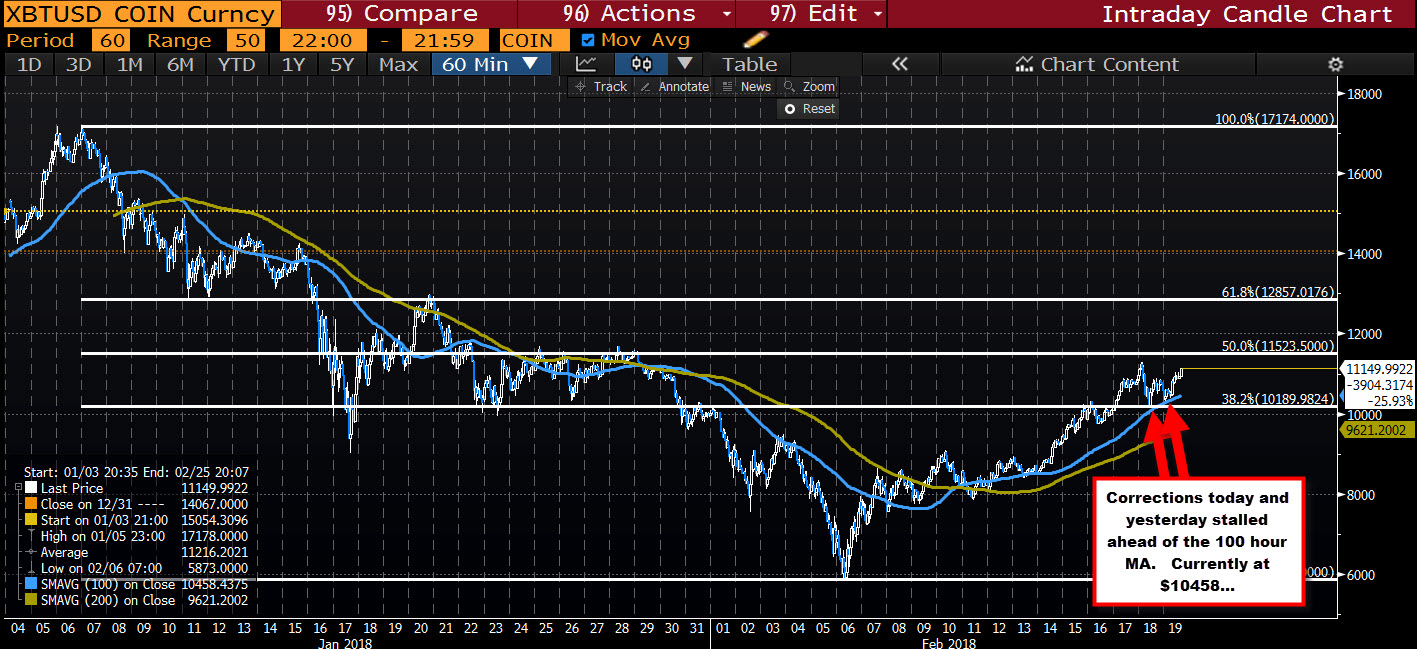
The 100 hour MA stalls the fall today and yesterday
The price of bitcoin has moved higher in trading today and looks toward testing the high from Sunday's trading at $11,299.
Technically, the bias is more bullish.
Looking at the hourly chart, the digital currency moved back above the 100 hour MA on February 12th and apart from a few little peeks below that MA line on February 13th (blue line in the chart above), the price has stayed above that line. Yesterday, the MA line was tested and again today the same MA was tested. Each time, buyers came in, and pushed the price higher.
Stay above the MA line and the bulls remain in control. Break below and the move higher should lose some steam.
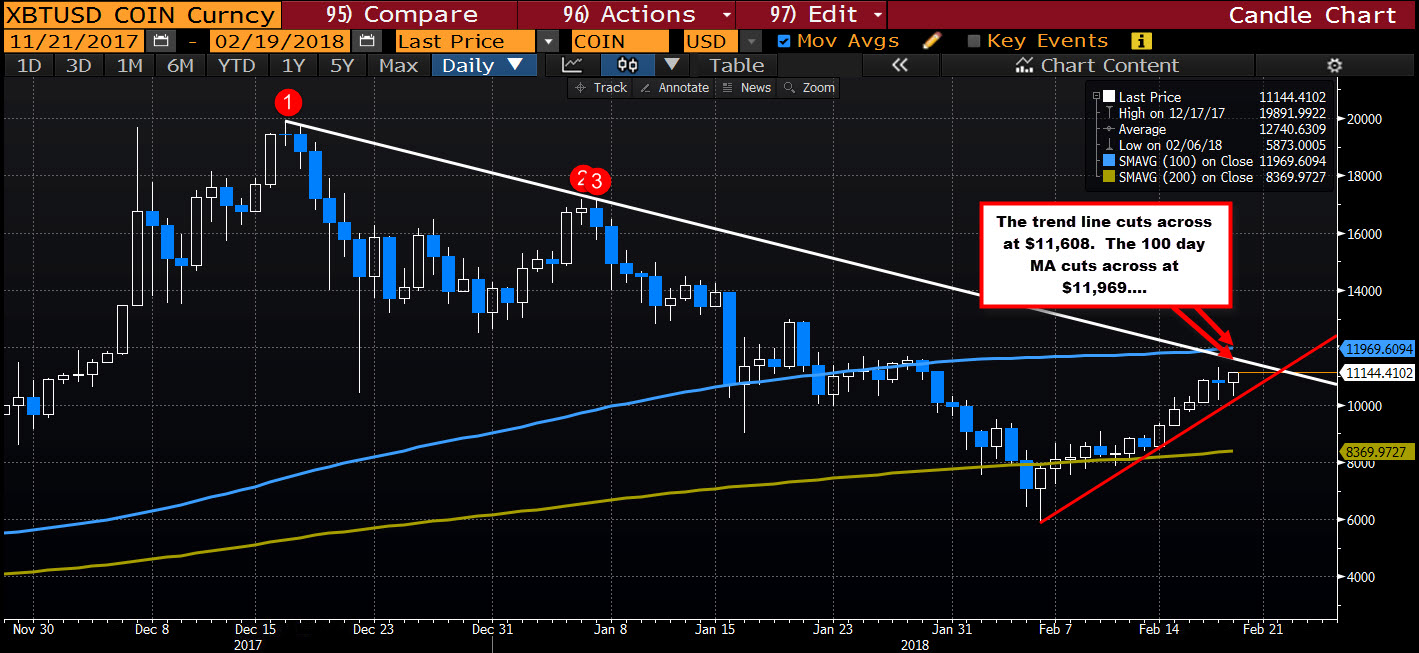
Taking a broader look at the daily chart below, the price is moving toward some key technical targets.
The first comes in at a topside trend line at the $11,608 level. The next target above the comes in at the 100 day MA at $11,969. Although the hourly chart is showing more bullishness from that perspective (above the 100 and 200 hour MAs), the price still remains below the downward sloping trend line and the 100 day MA. If the bulls from the hourly are to take the move higher, getting above those levels will be eyed for more bullish confirmation
SUMMARY: The price action of bitcoin off the hourly chart, pointed higher and moved higher off the hourly chart. Stay above the 100 hour MA keeps the bulls more in control. However, the topside trend line and 100 day MA is up ahead and should stall the momentum on tests. Be aware.

