Looks to test next technical target
The USDJPY has continued its move higher after the better than expected US GDP revision to the 1Q (1.4% vs 1.2% estimate and consumption up 1.1% vs 0.6%). The move has the pair trading toward a topside trend line on the hourly chart at 112.88. The high has reached 112.84. The pair is trading at the highest level since May 17th. Traders may be taking some profit against the risk defining level with stops likely on a break above the level. Getting above the 113.00 level would be the next natural resistance level to get above. The May 17th high price reached 113.126.
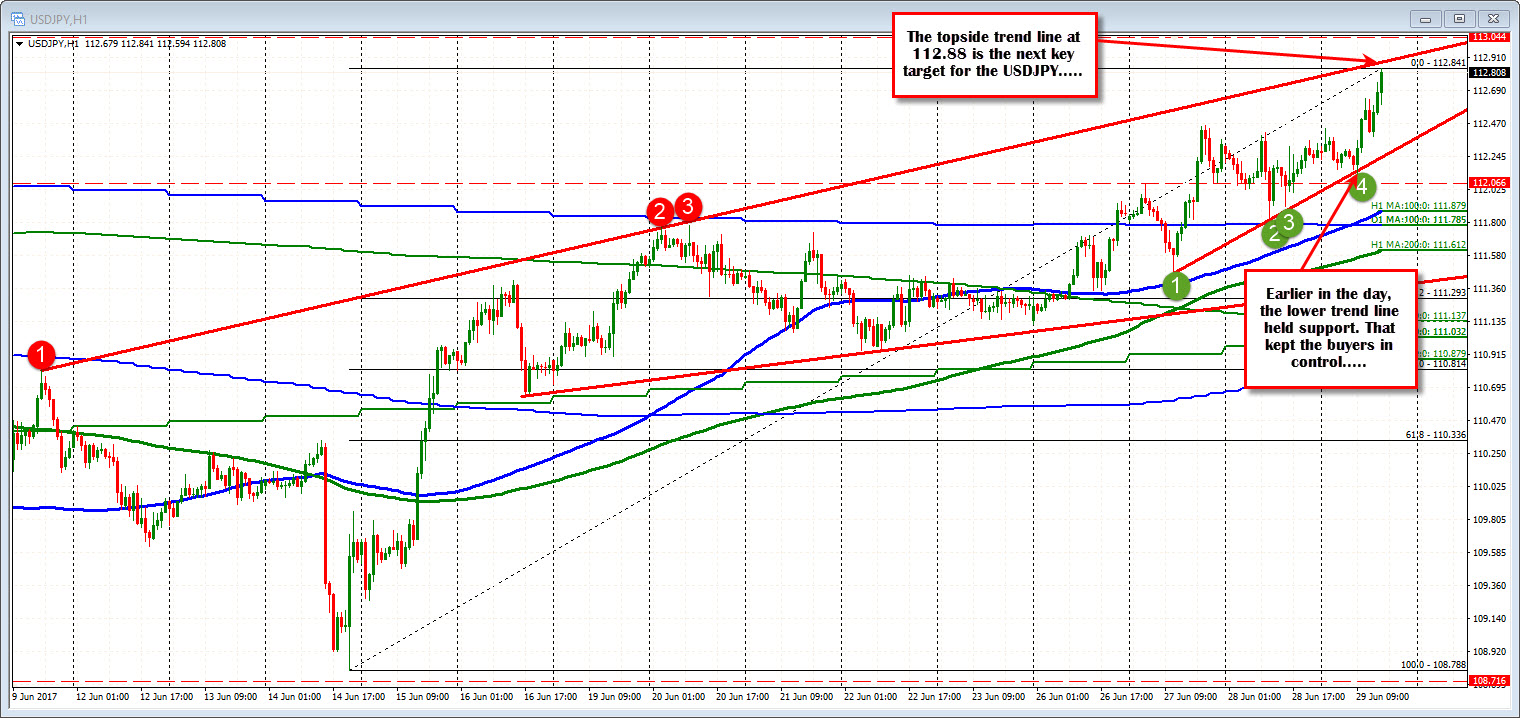
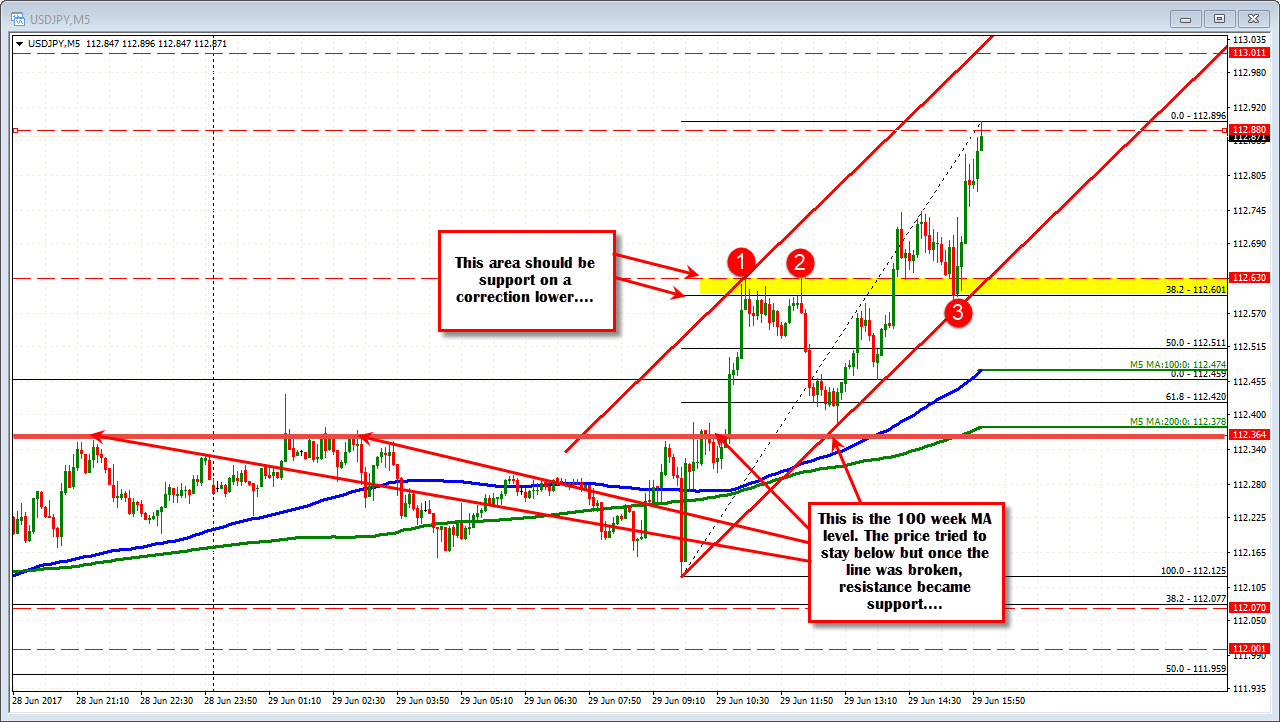
Technically, in addition to the topside trend line test, the pair tested a lower trend line at the day's lows and found willing buyers. That helped to start the ball rolling to the upside.
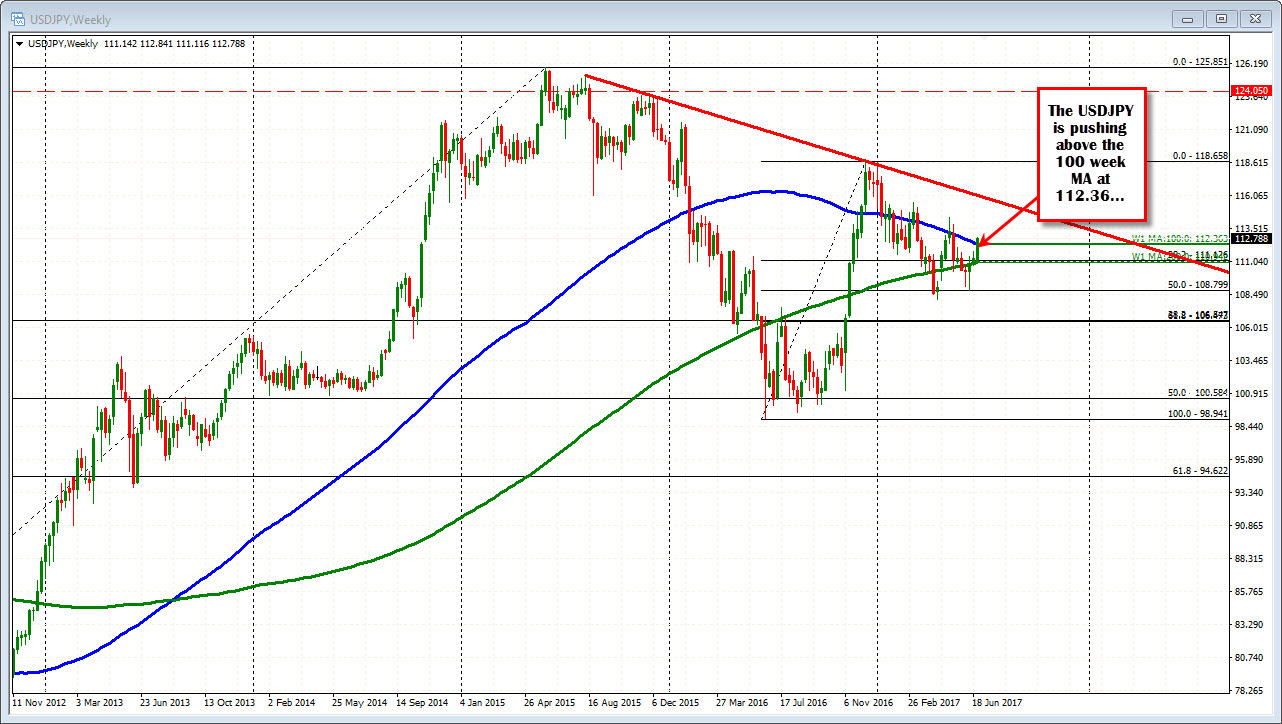
Taking a broader view of the pair, looking at the weekly chart, the pair today is making a push away from the 100 week MA at 112.36. Yesterday the pair moved up to 112.40 but closed below the level at 112.28. The 112.36 is now a key level to stay above for the bulls/buyers.
What is risk for longs/buyers?
Watch 112.60 as a support area should the price correct off the resistance. That is the 38.2% of the day's range and also near the swing high from earlier in the day and also a swing low from earlier in the day (see yellow area in the 5-minute chart below).