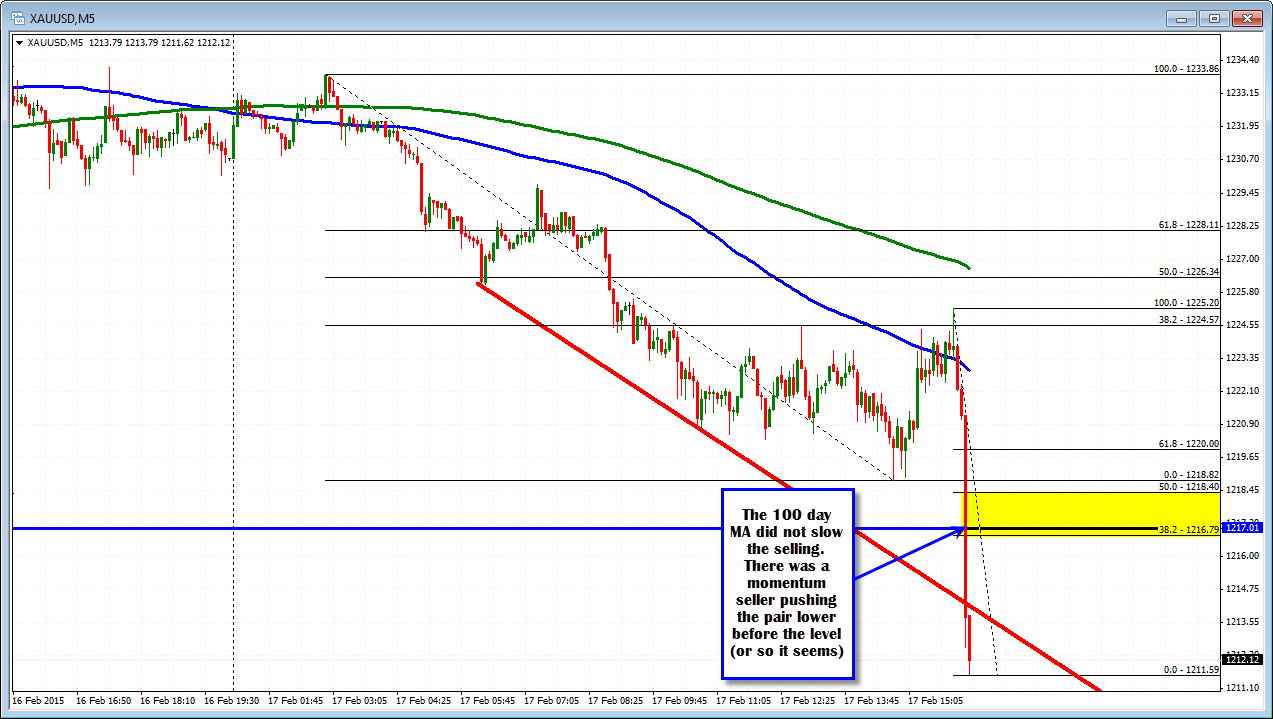
Momentum selling on the break takes the price quickly lower
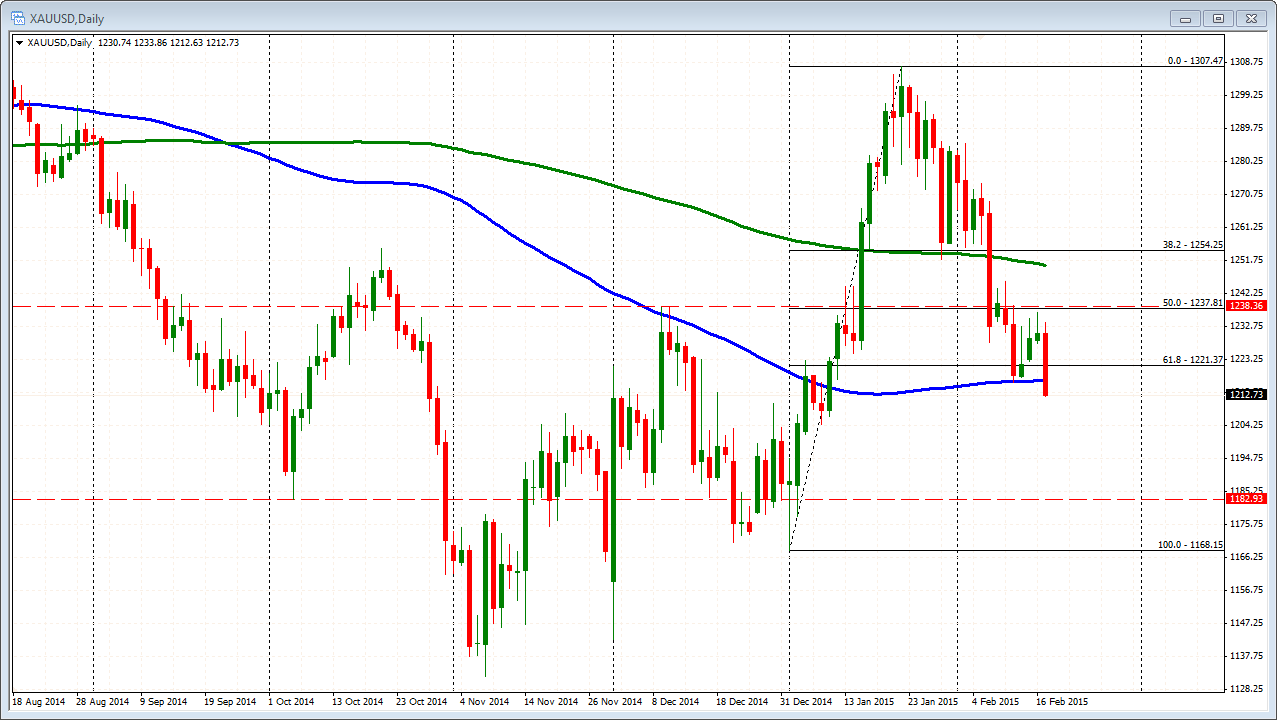
Gold is falling below the 100 day MA at the 1217 level (see blue line in the chart below). The break is leading to increased selling momentum, with the new lows at 1212.63. Last week the price held above this key MA on Tuesday and Wednesday. Sellers will now be eyeing the 100 day MA as a risk defining level.
Looking at 5 minute chart, the momentum to the downside started before the break of the 100 day MA at the 1217 area.