
Consolidates after the sharp fall on Monday
Gold fell sharply on Monday on the back of relief from the French elections. The price bottomed on Wednesday at 1259.84 and the market has been trading higher and lower. Today, the price is up a couple bucks. The high to low trading range is narrow (low $1263.17, high 1268.68)
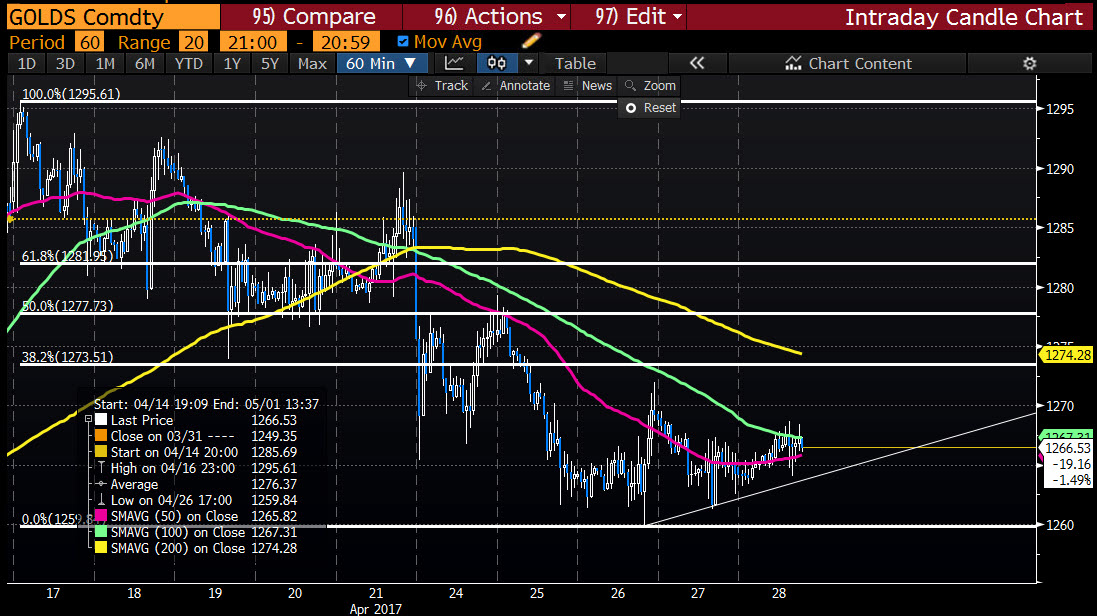
Looking at the hourly chart, the 100 hour MA has been able to catch up with the price as a result of more sideways trading over the last few trading days. The 100 bar MA come in at 1267.32 and there have been three bars that have moved above the level. There have been no closes above that MA line. If the price is going higher, technically, there needs to be a close (and stay above) above that level. If so, correction buyers would look toward the 1273.51 (38.2% of the move down from April 17th). and the falling 200 hour MA at 1274.28 currently (and moving lower).
If I were to take a broader view of the daily chart, the fall lower from the mid April high has moved toward the high ceiling from the end of March/early April (see chart below - near 1260). A move below that level will have the 200 MA at 1251.76 and 50 day MA at 1249.25 to contend with as key support.
So overall, gold remains more bearish below the 100 hour MA at 1267.31. Stay below = bears in control.
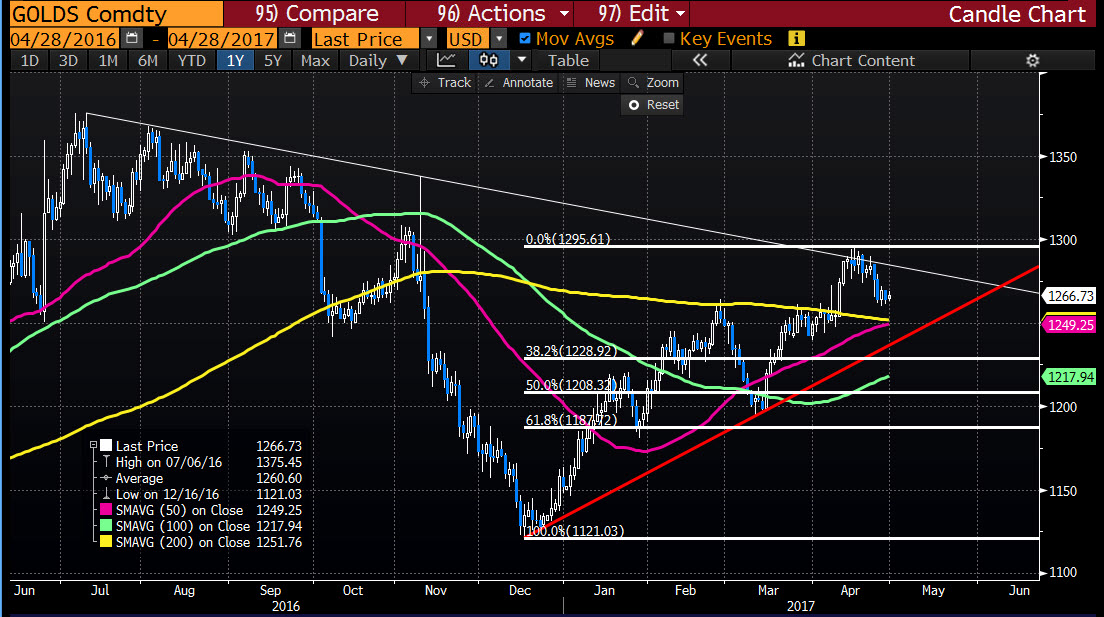
On the downside, the 1250 area is a key support area (1249.25-1251.76). Keep that area in mind going forward with a break below even more bearish. Holding and the fight between the sellers against hourly MAs and buyers against daily MAs continues.

