
Technicals are more bullish too...
The price of Gold is up $12 today to $1268 currently. The high extended to $1269.04. The low was down at $1250.97.
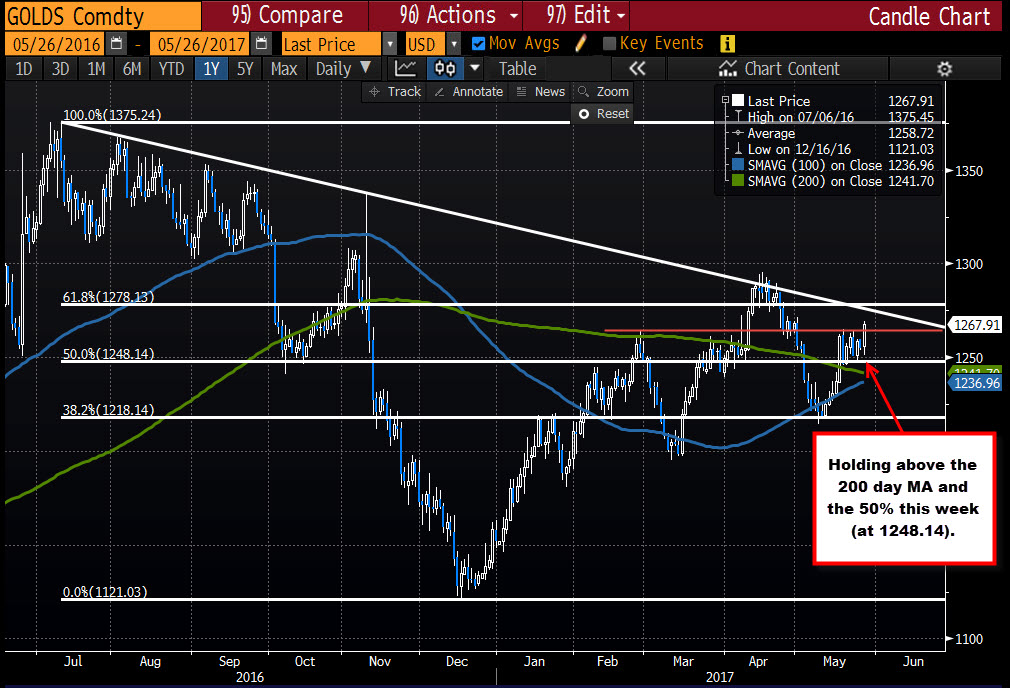
Technically, the price moved above the highs over the last 8 or so days and trades at the highest level since May 1st. Over those 8 trading days, the price has also stayed above the 200 day MA (green line in the chart above). This week, the price has been able to stay above the 50% of the move down from the July 2016 high at the 1248.14 level (the low this week was actually just below that level at 1248.08 but what's a few cents miss). Bullish.
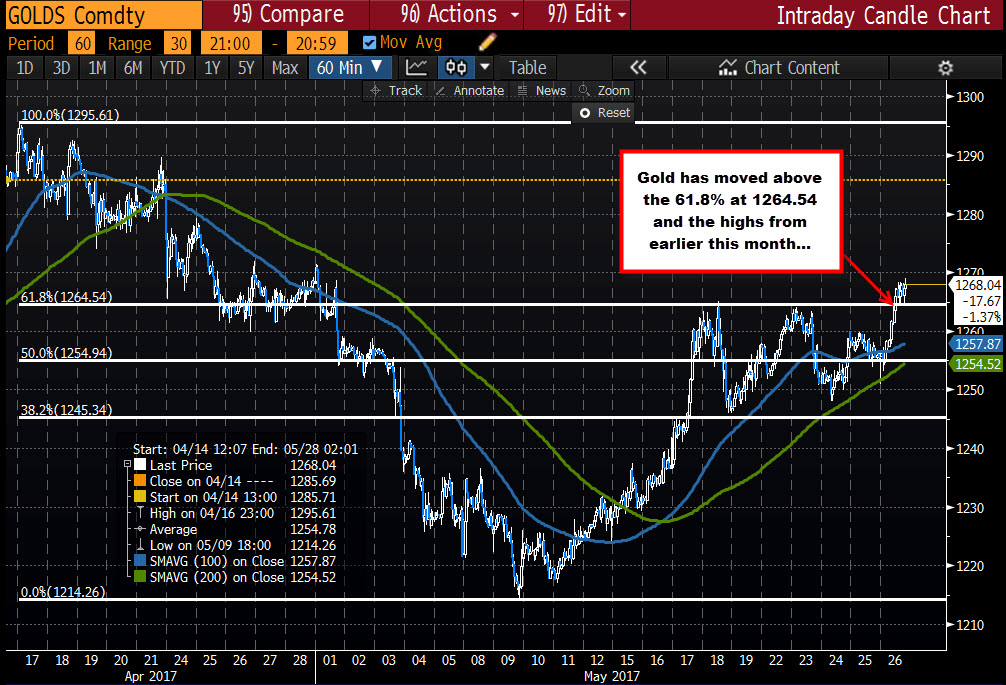
Drilling to the hourly chart, today the price moved above the 61.8% of the move down from the April 17th high at the 1264.54. That retracement level is finding support buyers. Bulllish above that line.
The market also bottomed today near the 200 hour MA early in the trading session. Holding that level gave buyers a reason to buy and get the price back above the 100 hour MA (blue line).
Where is risk for the bulls now?
Support now comes in at the $1264.50 area (61.8% retracement level). Other support is at the rising 100 hour MA at 1257.87 (and moving higher). Stay above and the buyers remain in control. Move below, and the waters turn more muddy.
It looks like a break higher today, but there is hurdles to go before buyers can declare a larger victory.
Nevertheless, getting above the 50% on the daily chart at $1248.14, and staying above the 200 day MA is more bullish. Staying above the 200 hour MA, and closing above the 100 hour MA, 50% and 61.8% retracement on the hourly chart is also more bullish.
Next week, we will see if the risk levels below can hold, and continue the upside momentum. Targets include $1276 (trend line on the daily), and the 61.8% at 1278.13. A move above each of those will have traders thinking $1300.

