
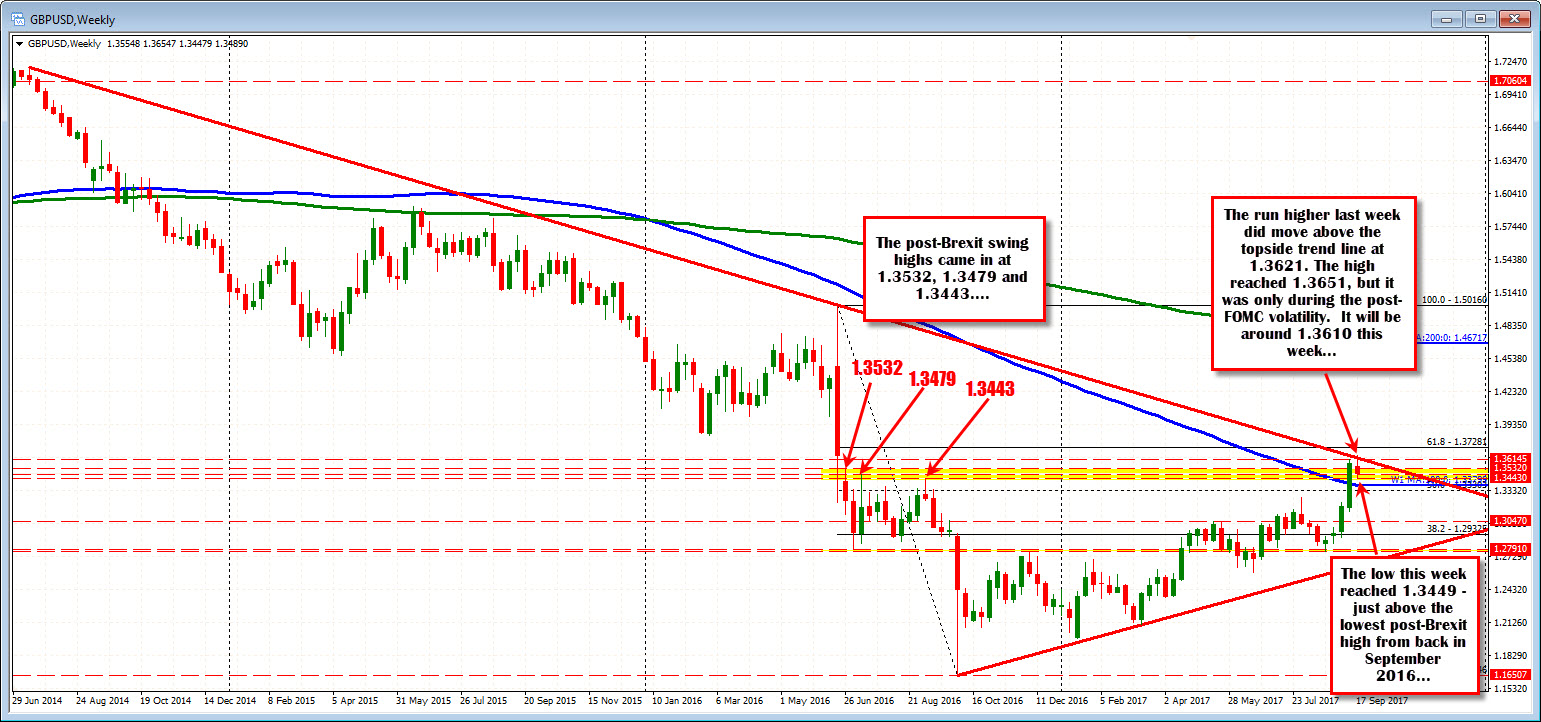
The post-Brexit swing highs stalled at 1.3532, 1.3479 and 1.3443. That area is an area to eye in the current week
Last week, the GBPUSD peaked on Monday at 1.3618. That was 2 pips from the Friday, Sept 15th high of 1.3616.
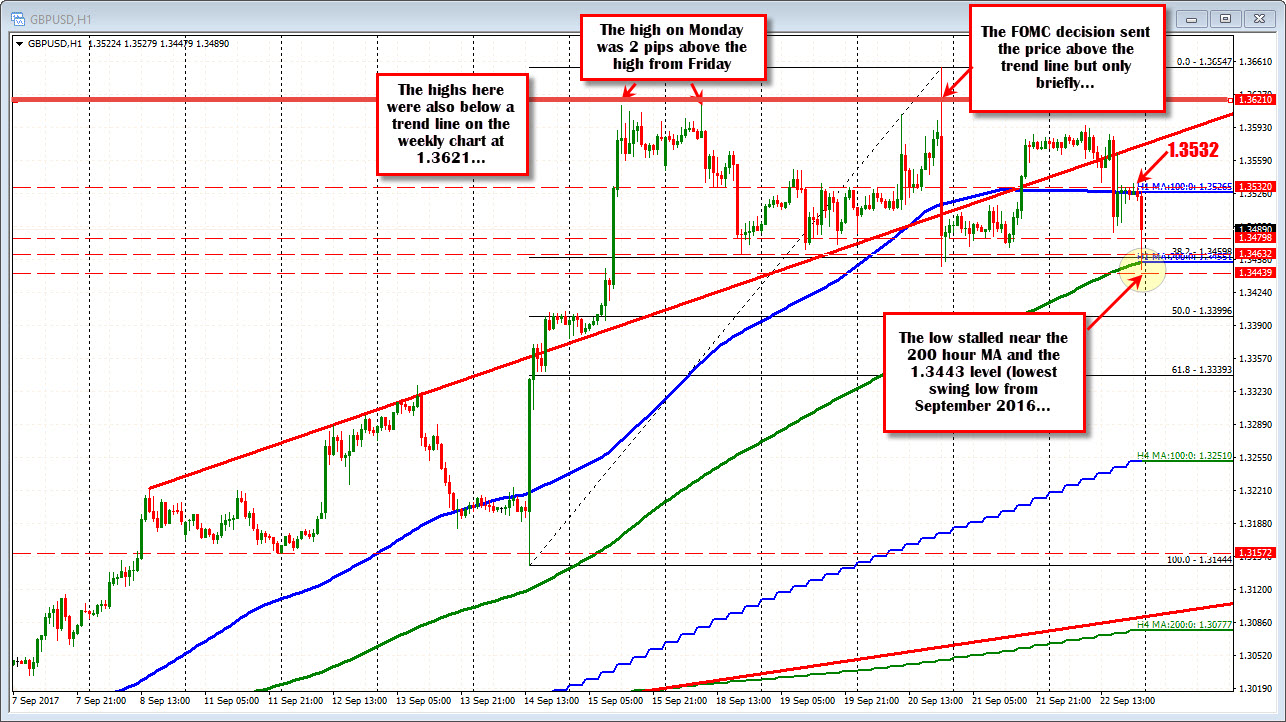
That high was just below a trend line on the weekly chart at 1.3621 (see trend line on the chart below). That was a ceiling for the pair for the week even though the trend line was broken Wednesday and moved up to 1.36547 in the process. The spike higher on Wednesday was a lack of liquidity spike in the seconds after the FOMC decision It seems stops were triggered, forcing the price higher but then back down soon thereafter. It happened. The trend line was broken but if I can put an asterisk on that high I would. Lets just say the trend line remains in tact and this week that trend line will cut across lower at 1.3610. Key level into the new trading week to get above IF the bulls take the control.
What about last weeks low. To understand why the pair stalled at the 1.3449 level, you need to look at both charts above.
On the hourly chart (the top chart), the GBPUSD fell in the last hour of trading to a low price of 1.3448. The green line on the hourly chart cut across at 1.3455. The price closed at 1.3489.
The fall was real, but it too could have been a liquidity (or lack there of) event. However, the 200 hour MA did do a good job of stalling the fall.
If you look at the weekly chart, the post-Brexit swing highs from June, July and September 2016 stalled at 1.3532, 1.3479 and 1.34439. The low in the last hour of Friday respected the lowest of those levels too.
As important the trend line in the new trading week, the 1.34439 level is just as important as a bias level on the downside. Each did there job in defining a high and defining a low. Each are important in the new week.
Is there any level in between the 1.3610 trend line above and the 1.34439 level below.
Once again the technical clues will come from the hourly and weekly.
Looking at the hourly chart, the 100 hour MA cuts across at 1.35265. The corrective highs in the NY session on Friday reached up to 1.3536 - around that level. The highs were also even closer to the post-Brexit swing high from June 2016 at 1.3532.
That says the bias is a little more negative below those levels but in the new week, should the price move it's way back above the 100 hour MA and the 1.3532 level, that bias would turn around.

