
Swing levels stall the rally. 200 bar MA on 4-hour chart approached.
In an earlier post I spoke about the choppy trading conditions in the USDJPY. I also told how today, the price action was still higher. We were above a trend line. We were above the 100 and 200 bar MA on the 5 minute chart.
We needed to get above:
- The 111.50 intraday ceiling level
- The 111.578-674 area which had a number of swing levels on the 4-hour chart (see yelllow area on the chart below), and then
- The 50% retracement at 111.81.
What happened?
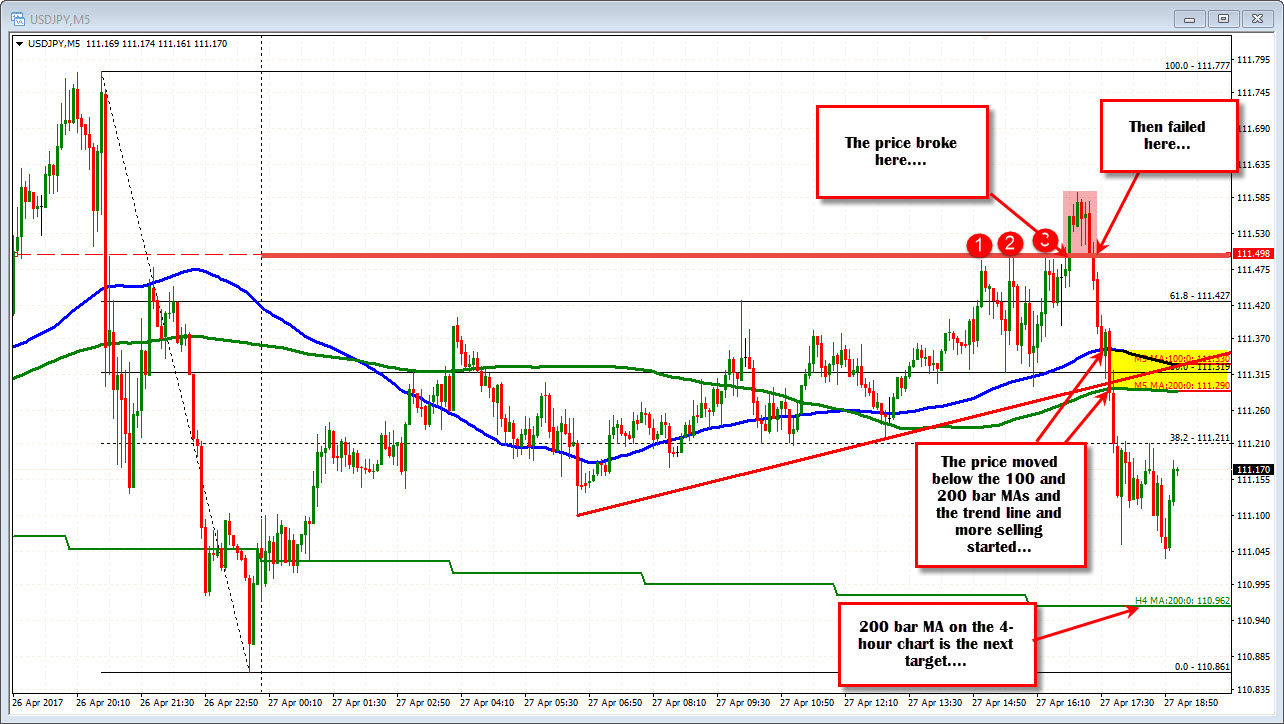
The price moved above the 111.50 level and moved to a high of 111.593 (see 5-minute chart). However, the price rally stalled in the 111.578-674 area at 111.59. When the price moved back below the 111.50 level (see 5-minute chart above), the buyers turned more to sellers. The fall below the 100 and 200 bar MAs and trend line on the 5- minute chart sealed the bearish fate.
We are now back down toward the 200 bar MA on the 4-hour chart at 110.96.
It may be the chop continues with the 200 bar MA stalling the fall and those 5-minute MAs acting as close resistance now. Those are the risk defining levels at least as the market decides what it wants to do next.
Chop. Chop. Chop.

