
| EUR/USD Chart Levels: Support 1.3900..1.3850..1.37. Resistance 1.396..1.4026..1.4100. | ||||
| Strategy | Entry | Stop | T1 | T2 |
| Intraday: Long | 1.3750 | 1.3640 | 1.4026 | 1.4100 |
| Weekly: short | 1.4275 + add 1.4400 | 1.4490 | 1.3890 | 1.3750 |
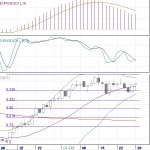
The euro is falling, while remaining within the medium-term correction upwards. Bollinger band on the daily chart shows bullish momentum with the closest targets 1.4026 and 1.4100. Selling pressure eased. In this context, it becomes more tempting to pick up the euro on the local bottom with close stop orders.
Based on the chart, the curve of moving average mA (200) continues to fall, favoring long-term bearish view. A mA (21) signals a short-term bullish preference. However, MACD (divergence) and Sstoch show buy signals and can be traded Long intra-day. Support levels that were tested at 1.3900 and 1.3850 were the closest targets for the Fibo correction. The immediate target of the bull market is 1.4026 level.

