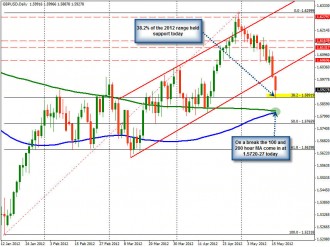
The 38.2% of the 2012 range for the GBPUSD comes in at the 1.58919 level. The low today came in just below that level at 1.5888 and rebounded higher. The holding of the level has put the sellers on the defensive a bit and there has been some corrective buying as a result.
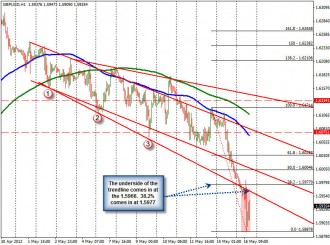
On the hourly chart below, the 38.2% of the move down from the weeks high comes in at the 1.5977. There is broken trend line resistance at the 1.5966 level. This area (between 1.5966-77) will be eyed for sellers. If the sellers can keep the price below this level, the bias remains to the downside. A move above, and further corrective buying will be eyed with the 1.6000/04 a key target. The underside of the broken trend line on the daily chart above comes in at 1.6002 today. The 50% of the weeks trading range is at 1.6004. This is a key level for the bears to defend.
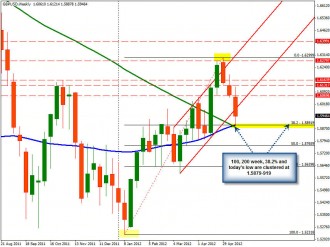
Of note is the 100 and 200 week MA are clustered together and also near the low/38.2% retracement level. The 100 day MA is at 1.5893. The 200 day MA is at 1.5875. With the 38.2% of the move up from 2012 low at the 1.58919 (and the low at 1.5878), the area is lining up as a key, key level.