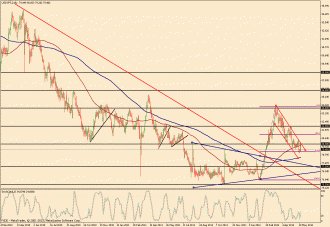
5/23/2012 – Price action on USD/JPY (a daily chart of which is shown), as of 5/23/2012, has been descending within a clear channel for the last month. This downtrend channel occurs after price hit a long-term high just above 84.00 in mid-March. In turn, that rise to 84.00 resistance occurred after price broke out above a large triangle pattern near historical lows in mid-February. Currently, price is languishing just below the key 80.00 level within the descending channel. In the event of a breakout above 80.00, which would also represent a bullish breakout of the channel, price could begin targeting a key upside resistance target around the 82.00 price region. In the event of a bearish breakdown below the latest low around 79.00 (which is also the 61.8% Fibonacci retracement of the last major bullish run from 76.00 to 84.00), a key downside support target resides around the 77.50 price region.
(Chart courtesy of FXDD – Metatrader. Uptrend lines in green, downtrend lines in red, horizontal support/resistance lines in black, Fibonacci retracements in purple, 200-period simple moving average in blue, 100-period simple moving average in brown.)
ADVERTISEMENT - CONTINUE READING BELOW
ADVERTISEMENT - CONTINUE READING BELOW
ADVERTISEMENT - CONTINUE READING BELOW
ADVERTISEMENT - CONTINUE READING BELOW
ADVERTISEMENT - CONTINUE READING BELOW
ADVERTISEMENT - CONTINUE READING BELOW
ADVERTISEMENT - CONTINUE READING BELOW
ADVERTISEMENT - CONTINUE READING BELOW
ADVERTISEMENT - CONTINUE READING BELOW
ADVERTISEMENT - CONTINUE READING BELOW
ADVERTISEMENT - CONTINUE READING BELOW
ADVERTISEMENT - CONTINUE READING BELOW
ADVERTISEMENT - CONTINUE READING BELOW
ADVERTISEMENT - CONTINUE READING BELOW
ADVERTISEMENT - CONTINUE READING BELOW
ADVERTISEMENT - CONTINUE READING BELOW
ADVERTISEMENT - CONTINUE READING BELOW
ADVERTISEMENT - CONTINUE READING BELOW
ADVERTISEMENT - CONTINUE READING BELOW
ADVERTISEMENT - CONTINUE READING BELOW
ADVERTISEMENT - CONTINUE READING BELOW


