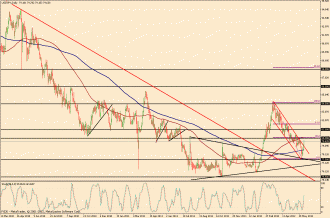
6/7/2012 – Price action on USD/JPY (a daily chart of which is shown), as of 6/7/2012, has broken out above a clear bearish channel that has been in place since mid-March. Price within this bearish channel reached a low of 77.65 (also the top border of a large triangle pattern that was broken to the upside in mid-February) before rebounding and then breaking out above the current channel. Currently closing in on the key 80.00 psychological resistance level, the channel breakout would be confirmed on a breakout above 80.00. In that event, a key upside resistance target resides around the important 81.00 price region.
(Chart courtesy of FXDD – Metatrader. Uptrend lines in green, downtrend lines in red, horizontal support/resistance lines in black, Fibonacci retracements in purple, 200-period simple moving average in blue, 100-period simple moving average in brown.)


