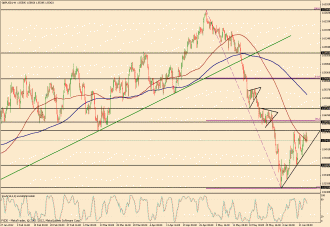
6/13/2012 – Price action on GBP/USD (a 4-hour chart of which is shown), as of 6/13/2012, has consolidated in a clear ascending triangle pattern within a strong intact downtrend that has been in place since the 1.6300 area high was hit at the end of April. The current triangle represents both a correction and a consolidation/congestion zone that comes in the midst of the swift downtrend that has characterized the pair for the last month and a half. The top horizontal border of the ascending triangle resides very clearly around the 1.5600 level, which is also a key prior support/resistance level. The current correction that is represented by this triangle has not yet reached the 38.2% Fibonacci retracement of the downtrend from the late-April 1.6300 high to the early-June 1.5265 area low, so it should not yet be considered a major correction thus far. This could certainly change if the correction continues to the upside with a breakout above the triangle’s top border at 1.5600. With respect to the current downtrend, though, the key technical event to watch for would be a breakdown below the lower border of the triangle, which would hint at a potential downtrend continuation. In this event, key initial downside support targets reside around the 1.5400 level, and then the mentioned 1.5265 area low.
(Chart courtesy of FXDD – Metatrader. Uptrend lines in green, downtrend lines in red, horizontal support/resistance lines in black, Fibonacci retracements in purple, 200-period simple moving average in blue, 100-period simple moving average in brown.)


