
Will it be Tsipras or Samaras? Will there be a majority? If not (likely), will the leading party be able to form a coalition government? If not will the other parties be able to unite? If not, what then? If the parties are able to united, does it mean “stay and play” in the EU or “exit and forget it”? What is the response from the EU/from the world’s central bankers?
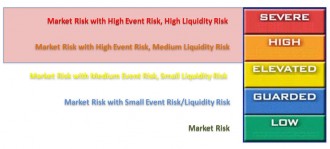
For me, “The Trader’s Risk-O-Meter” is at the Severe to High area with Market Risk, Event Risk and Liquidity Risk all pinned toward the top of the scale. I typically prefer when risk is the least. That does not mean there is no risk in trading (there is ALWAYS Market risk), but if I have the chance to get in a bar room fight, and the tough guy I potentially face is stronger, faster, and more coordinated than I am (i.e., Market, Event and Liquidity Risk is at the highest level), sometimes it is best to walk away from the fight (i.e., not trade), or wait until the tough guy’s back is turned or he is so drunk he loses his speed and coordination (i.e. when Event and Liquidity Risk is less). In other words folks, not fighting right away is an option. The same goes for trading.
A bar room fight is about to begin in the market.
So what to do? One, be aware and prepared. Two, trade when Event and Liquidity Risk has died down. I know it may not be manly to cower away but for me, it is often best to live another day in trading. There will always be another trade, and if that trade occurs when the risks are less, that gives the trader more control in his/her destiny.
How can traders be more prepared for the market ahead? Find the key technical levels and define risk against those levels.
Daily Chart:
Looking at the daily chart, the price on Friday closed near key resistance at the 1.26667 level. This level represents the 38.2% of the move down from May 1. This will act as my bullish or bearish borderline. If the price moves above this level = bullish. If the price stays below = bearish.
Technically speaking, the move up from the May swoon, is just a correction. The price has simply corrected to the 38.2% and held. However, if there is a move above this level and the price stays above this level, I would expect further upside momentum to prevail. In other words, as long as the price remains above the 1.26667 level, the corrective bullish bias remains with the next targets will eyed by the bulls.

On a move above the 1.2667, the next key targets from the daily chart would be the following:
- 1.2778/84 – This is topside channel resistance and the 50% retracement
- 1.29017 – 61.8% of the move down from the May 1 high
- 1.2973-1.3003- Low from Feb, Low from March, and Low from April.
- 1.3031 – 100 day MA
I would consider the 1.2778/84 to be a strong level as it includes two levels in the same area (confluence). The 1.2778 is the topside channel trend line, and the 1.2784 is the 50% of the move down from May 1. If the price is able to get above, I would expect further upside momentum (the 1.2778 would be the SL should that break fail). The next key target would be 1.2901 where the 61.8% of the move down from May 1, and the high from May 14 and low from May 11 are found. This too is a key area where confluence is found. The 1.2973-1.3003 includes lows from February, March and April and like the prior two levels, represent an area where traders can expect selling/profit taking.
If, on the other hand, the price should open (or move) below the 1.26667, the key levels to target on the downside would be the following:
- 1.2552 = Bottom Channel Trend Line
- 1.2434-41 – Recent lows over the last few weeks of trading
- 1.2286 – Low for 2012
Similar to a move that takes the price above the 1.2667, I would expect that traders target these key levels. A break below the levels should solicit additional selling pressure to the downside. I would expect the broken targets to then become stops should the momentum fade (for whatever reason).
Are there any key levels to eye to supplement those levels from the daily chart?
Looking at the hourly chart (see chart below), traders can often find closer targets for added confidence of a directional move. Like on the daily, the same 1.2667 will be the Bullish/Bearish borderline . On the topside, the levels that I consider significant from this chart include:
- 1.2700 and 1.2721 – Topside channel trendline. Both line parellel the bottom channel trend line that has support at 1.2605 (see chart)
- 1.2778-84 is from the daily chart (top side channel resistance and 50% of the move down from May 1)
- 1.2875- Top side trend line (blue 1, 2, 3)
On the downside, a move below the 1.26667, would target:
- 1.2605 – Bottom channel trendline
- 1.2541-49 – 200 hour MA (green line), 100 hour MA (blue line) and 50% of the move up from the June 12 low. This is key support.
- 1.2513- Trend line connecting lows from June 1
- 1.2434-41 – Lows from June 6th, June 8th and June 12

These two charts will be the roadmap for bullish or bearish given the reaction from the event risk/liquidity risk. If the bias is bullish and the price finds momentum above 1.26667, I will look for the price to take the steps higher as outlined in the hourly and daily charts.
If the bias is more bearish (i.e. below the 1.26667), I will look for the steps to progress lower as per the two charts.
On breaks, I will look for further momentum in the direction of the move and for the market to head to the next target. The broken level, becomes the support or resistance on the break.
Finally remember, if you are not comfortable with the market, event or liquidity risks (or if the news is not clear enough for you), there always is the option to not trade. Trading is about making the most money with the least amount of risk. If risk cannot be defined because news is still unclear, wait until event risk/liquidity risk is more known and therefore comfortable to you. You may save yourself from some hefty losses, while saving some amunition for when you really should be trading.

