
AUD/USD tech levels 18 April
My old favourite is knocking around the 1.0300 area once again. The last time I did some analysis on the pair we were stuck in a closing wedge. We’ve since had breaks both above and below. 1.0584 high and 1.0115 lows. We’re back in the wedge and the market is getting ready for a breakout either way.
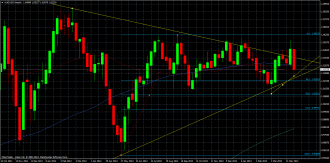
On the weekly chart we’ve broken through the 100 ma at 1.0361 and the candle is still holding above the 55 ma at 1.0321 . If we close the week below then we could see a further push to the downside. The nearest fib level is down at 1.0102 which is the 50 fib level from the May 2012/Aug 2012 lo/hi. It’s still intact from the 2013 year low.
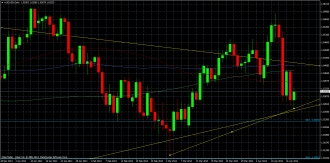
Zooming in to the Daily chart the last two days have been thwarted at the 200 ma at 1.0392 with the 100 ma lurking above that at 1.0408. The confluence of these levels with the 1.0400 big figure should present some decent selling against those levels. Before that though is the 55 ma at 1.0352 which is looking like a minor hurdle going on previous days action.
Lastly on the H4 chart we have the smaller trend line below coming in at 1.0270 and the 200 ma at 1.0384. The upper long term trend line is at 1.0419 with the 55 & 100 ma going hand in hand at 1.0430/35.
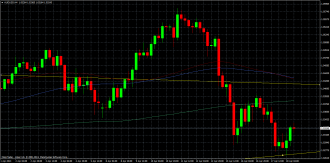
All in all tech wise, there’s quite a build up just above 1.0400 and that may well present a cap on higher moves for now.

