
For the last month or so, stock market technical analysts have been pointing to the correlations between price action in 1987. For instance, the last time the FTSE had a 10-month winning streak was 1986-87.
The chart similarities are abundant and today, a particular one stands out.
If you offset the Nikkei daily chart by 9521 days (back to 1987), it almost matches perfectly.
- That time, the index had a remarkably smooth 89% rally that began in early November and lasted 186 days which was followed by a whopping 9.11% correction.
- This time, the index had a remarkably smooth 85% rally that began in late October and lasted 191 days and then corrected 9.15%.
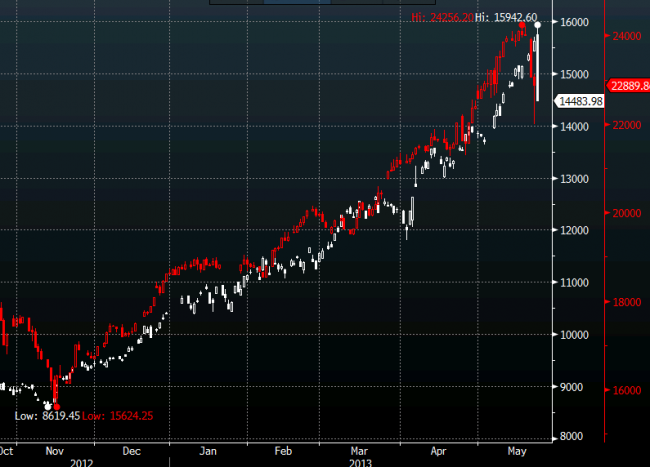
Nikkei 1986-1987 versus current
What happened next in 1987?
The decline completely reversed three days later and within 6 weeks the index was 18% from the bottom.
But that wasn’t the end of the story. In June the Nikkei topped and then sank back to re-test the May low. Then the index rallied once again and it hit a fresh high in October right before Black Monday.
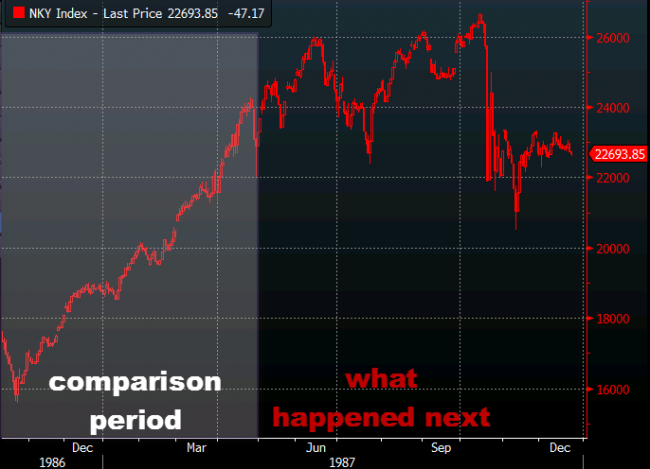
Nikkei 1986-87
What did it mean for the yen? In 1987, the 9% correction marked a medium term low in USD/JPY and there was a 10-week correction.
It would be nice for traders if history repeated itself perfectly but it almost never happens. I’ve looked at dozens of charts that synch up as perfectly as this one but they almost never continue.
My takeaway from this would be the change in volatility. The pre-correction rally was remarkably smooth afterwards, it was a choppy, messy ride. It’s going to be a wild summer.

