
I had just gone for a quick break, leaving Adam in charge and I come back with a drink and some crumpets, saw the screen and promptly lost them off the plate I was holding.
Goes to show how much was sitting at the 0.8580 level and how someone wanted to really bust it. I was expecting maybe 20 pips but not nearly 50.
We’ve busted all and sundry on the way down (so that’ll be an extra 10 mins work on tomorrows tech levels)
First and foremost watch for 0.8580 to become resistance on a move back up. The 55 dma is toast at 0.8582/84 as is the bottom of the channel at 0.8575, strong support and the 55 mma at 0.8562/67 and the 100 dma was knocked as well.
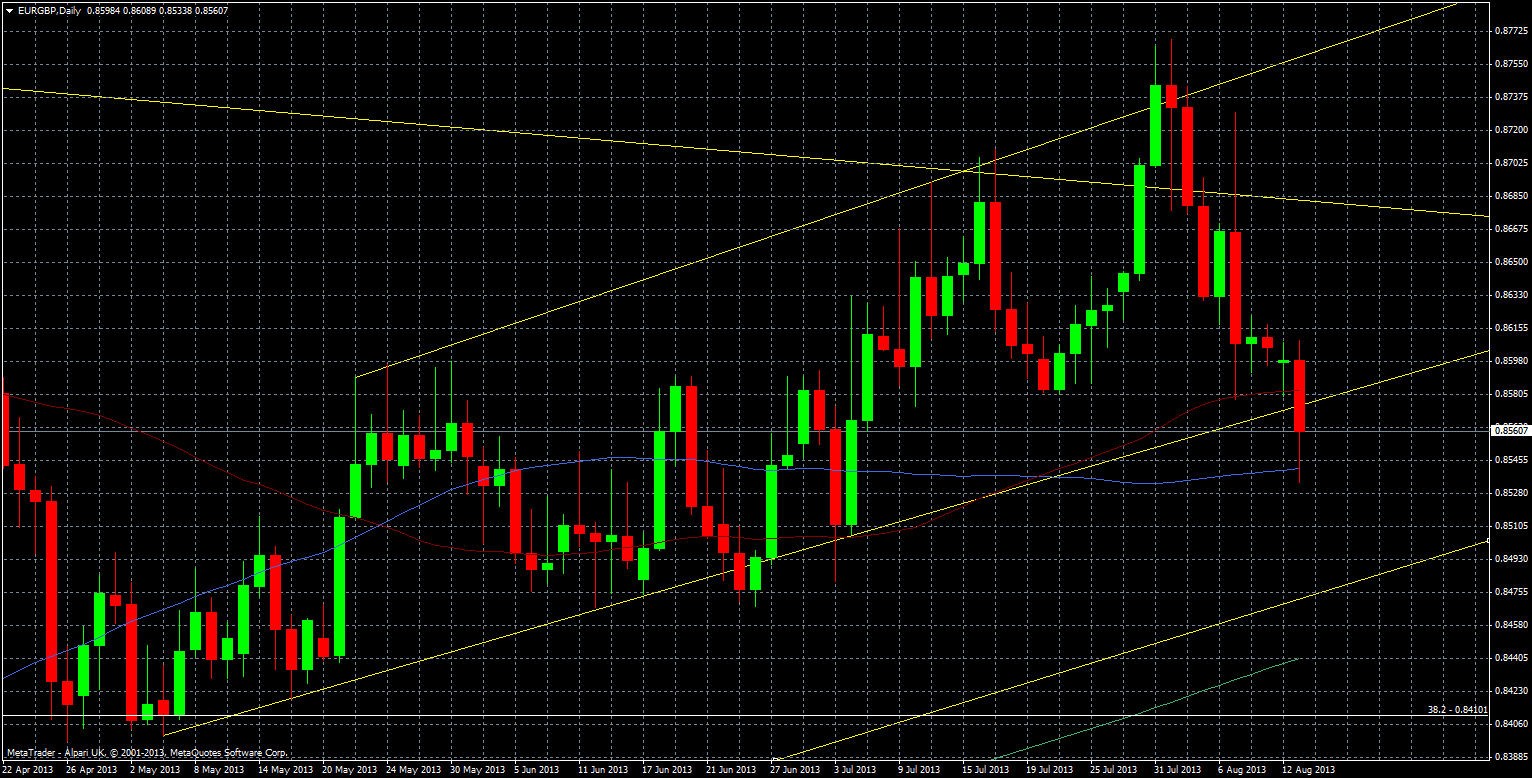
EUR/GBP technical analysis chart 13 August 2013
We’re back above the 100 dma as the coil springs back, but are struggling to reclaim the 0.8570 area with EUR/USD weakness keeping the pressure on. With that in mind we can look at what is below should the move continue. The 100 dma may pose better support on another, less frantic move down but my bigger interest lies down at the 200 wma and support line from July 2012. These both come in at around 0.8500.
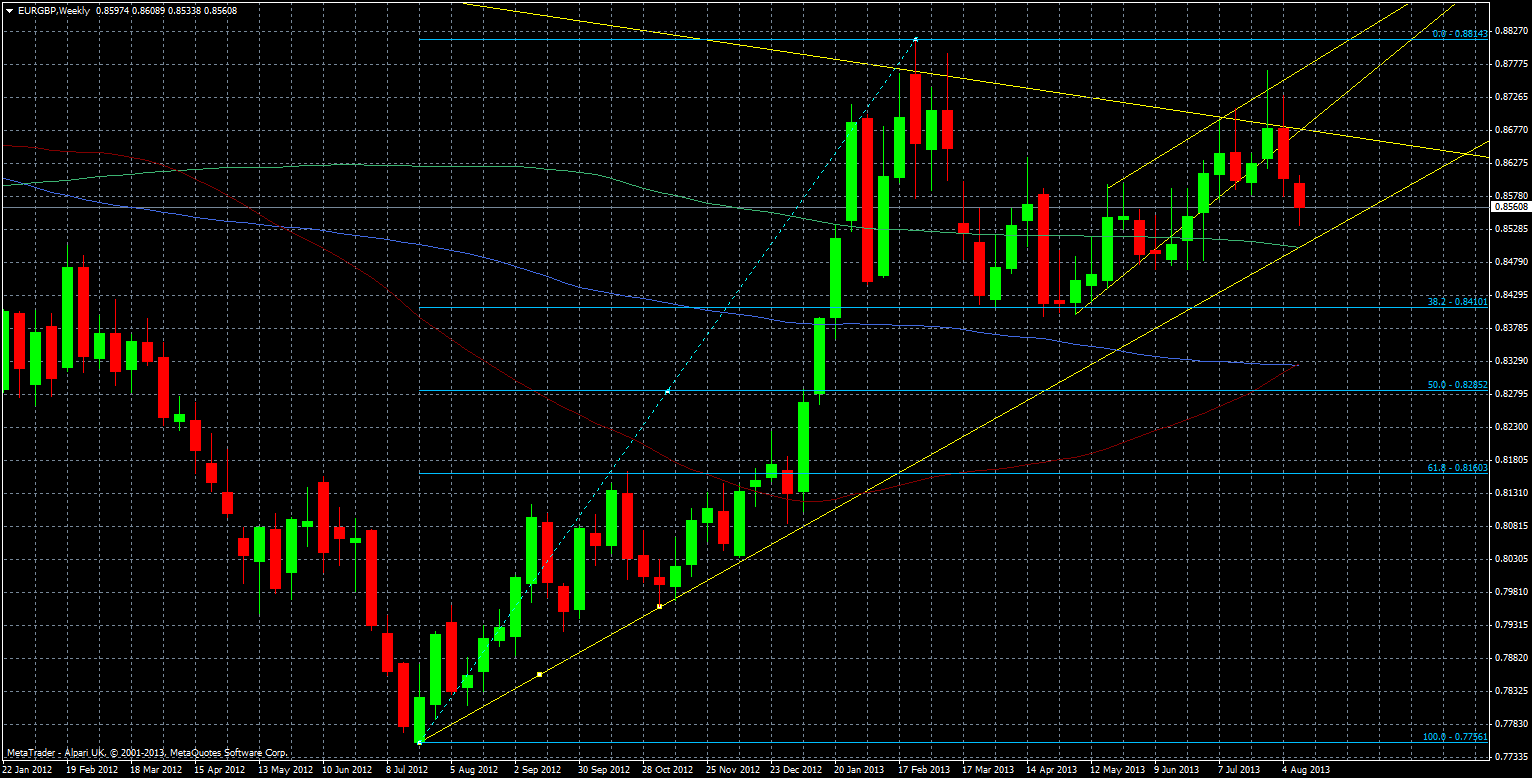
EUR/GBP Weekly Chart 13 August 2013
A break from there will open up the door to to the 38.2 fib also from July 2010 to the Feb 2013 high. This comes in at 0.8410.
As much as my short positions love the move it’s far to early to tell whether this is the start of a sustained move lower or just a stop hunt. The fact that we tested the 0.8580 level a few times in quick succession would suggest there is a vested interest in taking the pair lower. Certainly if EUR/USD continues lower I can see further losses as I don’t expect cable to follow suit with the same vigour. Just like the dollar yen move up I’m not going to get excited until the price action plays out some more.

