
Adam pointed to the risks on Syria fading yesterday as it fell down to the 100 dma. There are also several other technical support levels that should underpin the precious metal.
The 100 dma is at $1356 while a June support line is at $1354. Below there is the 50.0 fib from the August lo/hi at $1353, and lastly a minor channel bottom at $1349.
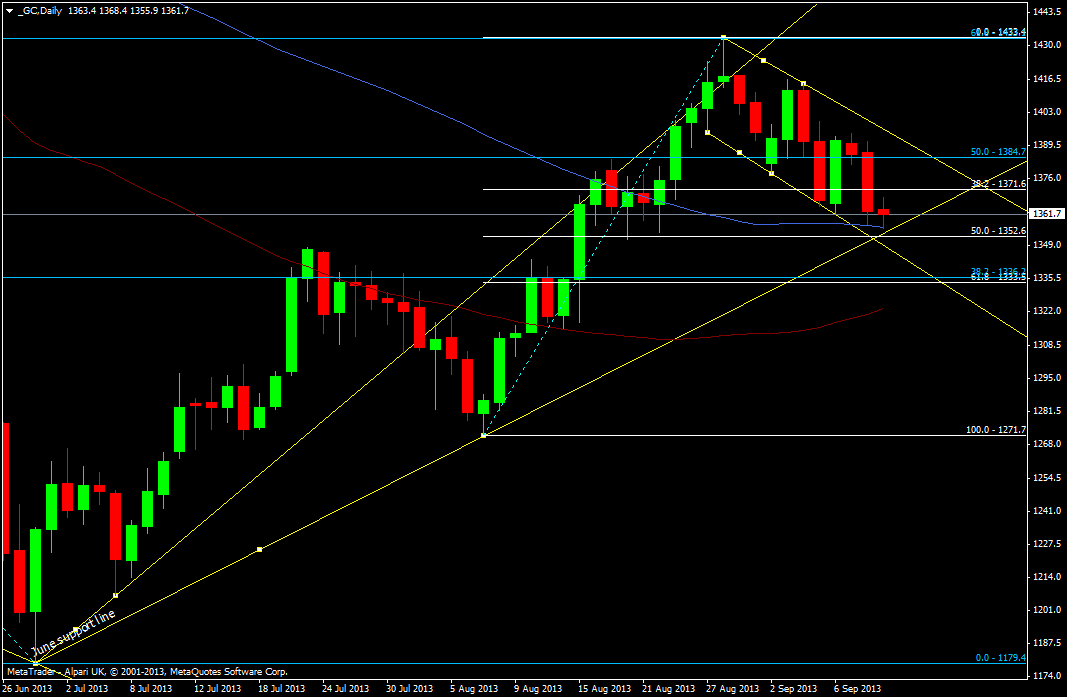
Gold daily chart 11 09 2013
That’s a fairly decent amount of support all added together and so a bounce can’t be ruled out. At the moment that’s not looking too hot and we can’t rule out another test of the support. A break of the 100 dma would certainly switch the emphasis to the downside and a further break of the support line could see a push down to the mid August lows around $1315.

