

Our second installment of Guest Trader kicks off today and reader Grasshopper will be spending the week imparting his wise views and analysis. The feature is designed to give other traders an insight into the minds of those that try to make sense of the trading world. You can find the previous Guest Trader posts here.
Please give Alex a warm welcome and if you have any questions he’ll be happy to answer them in the comments.

Name
Alexander Blake
Occupation
F/T trader
Trading experience
2 years full time, 6 years on/off, spot FX and spot Gold
Why you started trading?
Because nothing beats being your own boss, the mental challenge, and of course, the money.
Time zone you trade in
Asia + NY
Trading platforms/chart systems/screen set up you use
LMAX web platform/Sierra Charts (but soon switching to MotiveWave) and tradingview.com screen (17″ Macbook Pro laptop)
Methodology (Scalper, short, med, long term)
Scalper + short, pure technical analysis (fundamentals are for those who want to complicate things unnecessarily
) inspired and adapted from John Bollinger, Joe DiNapoli, Bill Williams, Larry Pesavento, and Sive Morten over at forexpeacerarmy.com.
Trades you are in or looking at
XAUUSD, JPY crosses, EURAUD, USDCAD, GBPUSD (the Devil’s currency, to quote Jamie Coleman)
Brief introduction
Some people are going to wonder “Who’s this guy?” and “Why should we even read his BS?”. Fair enough– that’s what I’d be wondering too. So let me tell you from the get-go what this ‘Guest Trader’ feature is going to be and what it is not going to be.
Obviously, considering I am still learning and have less years of experience than the more seasoned readers of forexlive.com, I will not pretend to give advice or even trade recommendations. That would be preposterous.
What I will do, however, is try to be of some help to greenhorns by using my experience of having gone down the road to trading hell and back, and back again since it seems I didn’t learn my lesson the first time around, to highlight those things that we should never lose track of, provide food for thought, and some classical technical analysis in between.
There will be not fundamental analysis as that is for those who want to complicate things unnecessarily. I can already hear the jeers and hoots of derision. OK, fine. Then explain to me what this has to do with fundamentals: http://blogs.marketwatch.com/thetell/2013/09/12/huge-gold-trade-trips-circuit-breaker-prompts-20-second-halt-nanex .
So I will be dealing only with pure technical analysis for intraday trading.And since the world is awash with too much information and we are all way too busy already, I will try to keep it to the point and as brief as possible.
So without further ado, let’s get started.
Food for thought
Back to basics. After making all the mistakes in the book, I had to face reality and ask myself: What is the key to success at trading? The bad news: There isn’t just one. The good news: There are only a few, and one of the them is to understand that one must master the 3 main poles of trading.
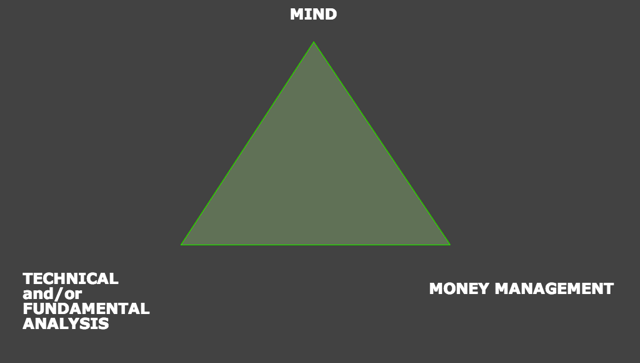
In my experience, the first and most important pole that we as traders need to get a grip on is the ‘Mind’ pole, or mental management. If you are a sociopath or a natural, and experience no emotions whatsoever, move on you lucky sod. For the rest of us, read on.
Consider this: No matter how good you are at money management or analysis, if fear, greed, anger, depression, or just sheer folly grips you in the middle of a trade, how do you think your trade is going to turn out? Sure, you can get lucky, and money management can save you from bankruptcy, but the trade will probably not have been a good one.
Here are a few solutions that help overcome unwanted emotions: Yoga, meditation, and whiskey. Mix at will! Of course, I am not saying you should get drunk. A dram or two, no more. As Eamonn was reporting last week, the latest research shows that a little bit of alcohol helps our problem solving ability. And it steadies the nerves! Make sure you don’t drink on an empty stomach. For teetotalers, a puff of the green goddess might help as well.
Chart(s) of the day
(Suggest you open the charts in a new window to follow the analysis below0
Note: the orange line is the 55 SMA; the green neon line is the 89 SMA; the pale green line is the 100 SMA; the dark green line is the 200 SMA; the dark blue line is the 800 SMA (not visible in the range at the moment). Also, the chart is a little busy because I display everything instead of having Ryan post 3 different daily charts. The beauty of tradingview.com is that I can easily toggle on/off the visibility of any of the graphical elements on screen, thus always looking at a cleaner chart.
Keeping in mind that this is for intraday only, let’s take a look at the daily and H4 charts.
(Again, open the chart in a new window)
First, let’s see what we have on the daily chart. The butterfly sell has completed at the 78.6%/CD and 50%/AD fibonacci retrace levels. Of note, the K-area (as defined by Joe DiNapoli) has not been respected at all. In fact, we have a huge bearish candle slicing right through it, which is not indicative of a bullish bias. Also take a look where last week’s action stopped: Right above the DPS1 and the top of the Ichimoku cloud. Price is holding below DPP and WPS2 and MPS2 as well as the 55 SMA, all bearish signals. However, the hammer is outside the standard deviation 2 Bollinger band, indicating a possible retrace closer to the mean and the first target on its way there is the 1st standard deviation band especially since volume was not underpinning the most recent move down. That being said, the market could also continue walking the band further down since on daily multiple oscillators shows that we are just coming out from OB (overbought) conditions.
Often, when this kind of price action occurs, market will re-test the K-area from the other side, which already happened early today during the Asian session as market can been seen touching the bottom of the K-area. That being said, a further push higher as a retrace move, not a reversal, to test the broken trend line and the upper bound of the K-area is possible as well, before resuming the drop through the 50% fib level to the next fib level, 61.8% and then key support at 1,272.78.
Now, let’s take a look at H4 and identify possible retrace targets on the upside for long intraday scalps, bearing in mind that the market could resume its drop starting from any of the significant levels we have above the current price level, be it a 38.2% or 61.8% fib, the inner Bollinger band, and so on. In this regard, note that we have the 38.2% fib, the 100 SMA, the broken trend line, and the Bollinger band standard deviation 1 all converging together at the same point around 1,353/54. Depending on price action, if I see some bearish signals, that is where I would re-establish shorts.
Finally, Bill Williams’s AO (Awesome Oscillator) has turned bearish.
On H4, the first thing that stands is out is that market is back near the middle of its PD (Probability Distribution, i.e. Bollinger midline (yellow)) after last Friday’s covering of short positions, but oscillators (not shown here) are still in the OS zone and just slightly turning up, and Williams’s AO indicator is still bearish. The dashed horizontal red lines indicate significant S/R. Also, we have the pivot point just above the broken bottom of the channel, which coincides with the 89 SMA on daily. Finally, the 1.618/XOP (Extended Objective Point) of the ABCD structure has not been hit yet.
More importantly, we have a new K-area (not to be confused with the old one that was breached on Friday) between the 31.2.% and 61.8% fibs (gray rectangle).
Honestly, H4 is not providing much of a clue as to where the market will go next.
So based on all this, if I were bullish, I would wait and see how it plays out on H4 around the mid Bollinger line. If the price drops back from there, and then finds support again around the Friday lows, I would go long until the K-area is re-tested and would bail at a failure to cross the bottom of the channel. If it shoots straight up from here, then no trade until some sort of a pullback with a clear indication that the bulls are back in control. (Now, of course, on very short timeframes, that would be another story as possible trade setups would be available.)
If I were bearish, I would wait until market clearly shows a failure to cross the Bollinger midline and bottom of the broken channel and would scalp short down to Friday’s lows. Or enter short at the K-area if the market manages to cross the mid Bollinger line and re-tests the K-area but fails to go bullish.
Obvious targets to the downside are Friday’s low, 61.8% fib on daily and 1,272 low.
Hope this helps some of you.
Good trading and godspeed!

