
We made hard work of the 1.2280 level on the way down and now that the pair seems to be over it’s little hissy fit (for now) maybe we can start looking up again. As is often the case former broken levels can act as S&R levels again when revisited.
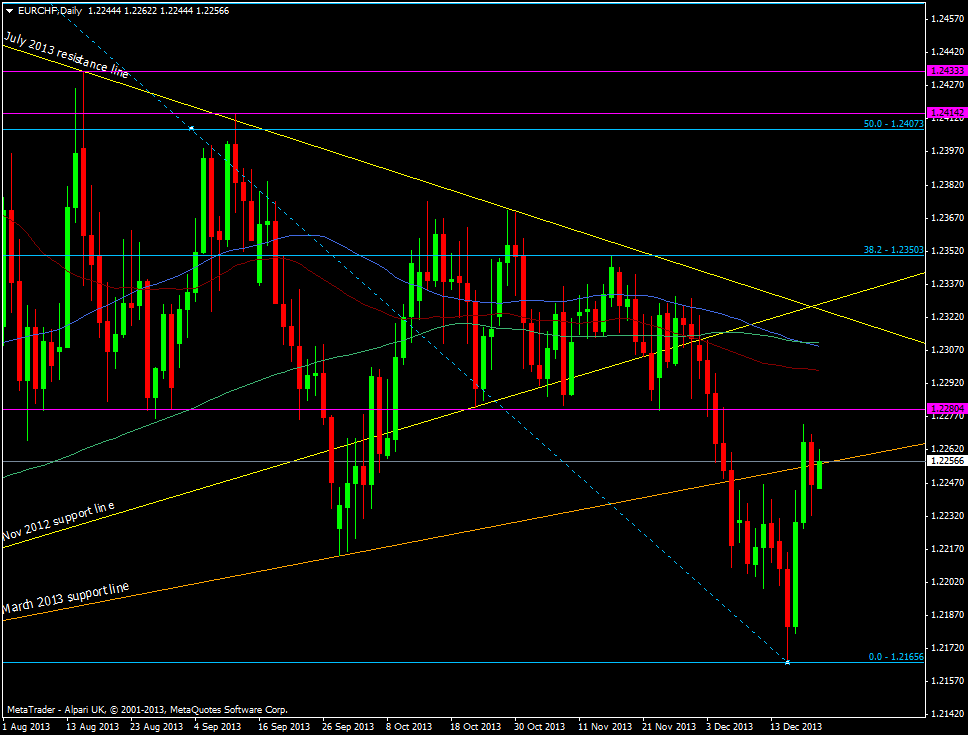
EUR/CHF daily chart 23 12 2013
We’re 20 pips off the 1.2280 level and have already been rebuffed once from 1.2273 last week so it looks like we may have resistance at the level.
A break above there will bring the moving averages into play. We have the 55 wma & dma at 1.2298 then the 100 & 200 dma in close proximity at 1.2309/11.
Looking at the chart all three daily moving averages didn’t have much affect on proceedings through October but they may do so if we continue north. Certainly above the there the July resistance line had played a bigger role and this is currently at 1.2325.
Unless we get some fireworks we’re likely to see out the year sub 1.23. The question is whether the rise from the recent lows was holiday season short profit taking or the start of a sustained move higher.

