
It’s the most-wonderful time of year… the time where technical analysts get to scroll way out and look at yearly charts.
The most shocking fact about 2013 for is that the euro was the best performing currency. Sure, Europe has recovered but so has the rest of the world and t the ECB is the most dovishly inclined of the major central banks at the moment.
A look at the annual chart offers hints at why. In the pre-crisis period the euro was a steady climber and was trading at around 1.45 as the crisis began to appear. Despite the insanity in the years ahead and the near-breakup of the year, EUR/USD never dropped below the 2005/06 low. That leaves a minor wedge pattern on the chart and similar to USD/JPY this year, wedges tend to resolve in the direction of the trend. In EUR/USD, that’s higher.
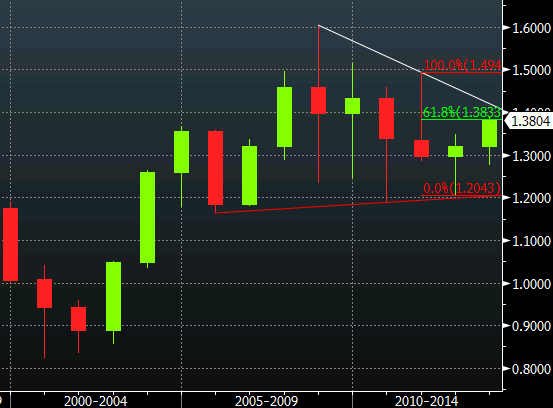
EURUSD yearly chart since inception
There are two important markers if EUR/USD is to continue higher, and they’re both very close by. The first is the 61.8% retracement of the 2011-12 decline at 1.3833. That level was also the September and early-December high. On Friday we spiked above it briefly but I certainly don’t trust a move in that kind of liquidity. If EUR/USD can post a weekly close above 1.3833 in the new year, I’ll be more convinced.
The break of that level would target 1.4940 on a purely technical trade but first I’d like to see a break above the downtrend, which will be at 1.3907 in January.
Until these two major technical levels are breached, I’ll stay away from euro longs. Given the risk/reward of this chart, I see a case for a modest short.

