
I’ve been pointing these out for a while and we’ve hit the 2002 hi/lo 50 fib and have busted it by 3 pips to the new high of 105.41.
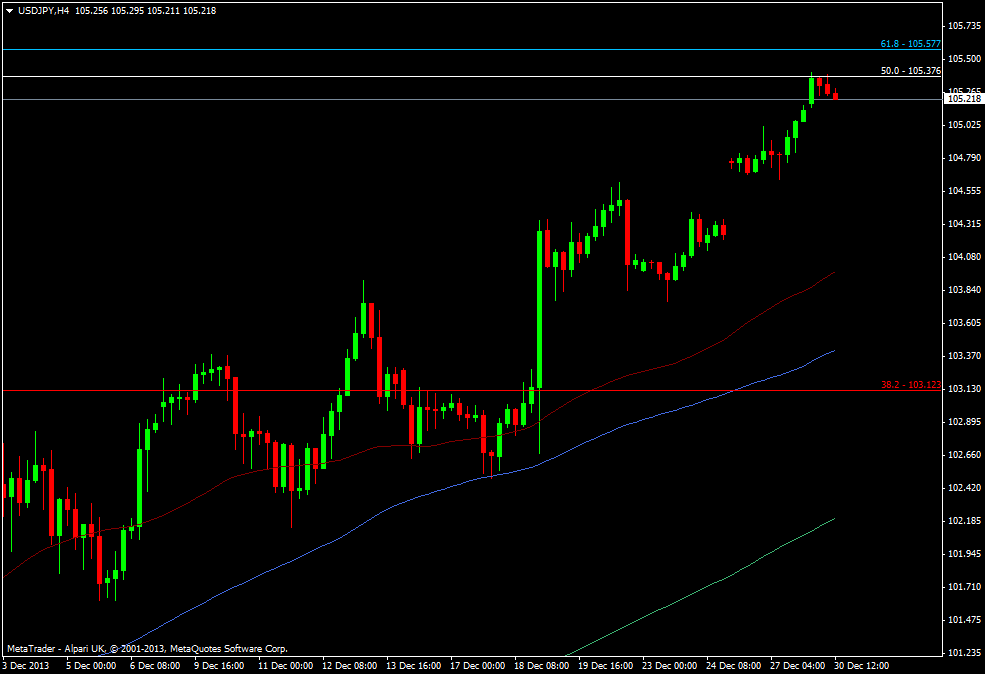
USD/JPY h4 chart 30 12 2013
The next big fib is the 61.8 2007 fib at 105.58.
The question will be how strong the level(s) may be and that will be based on how intent technical traders are in trading the level at this time of year, in these markets and against the current fundamental picture. Certainly both should be very strong levels ordinarily. With Japan closed until the 6th Jan further impetus will have to come from elsewhere so I can see these levels holding for now. We are also starting to see gravity take over in otherwise quiet markets and we’re falling from the latest high.
I’ve taken a short at 105.35, although I’ve kept it fairly small and tight given the conditions and the strength that the pair is showing. If it’s a toss up between trading technicals and fundamentals then I’ll side with the fundamentals 9 times out of 10. In this case the levels are too enticing not to trade them. I may add to that at 105.45/50 if we have another look up there and I’ll be out around 105.75.

