
Forex education from Steve Demmler

All good things must come to an end and alas it’s Steven’s last day as Guest Trader. As with all our participants he’s been fantastic and it matters not whether you trade differently or have opposing ideas, the basis of this whole industry is the same, to navigate through it as best we can and make it work.
“Do Your Thing”
This is it, my last few moments before the microphone is turned off and a cane unceremoniously yanks me off stage. Hopefully something in my five posts will improve your bottom line. But if something I’ve said leads to negative results, please e-mail Ryan Littlestone because I’m sure he’ll reimburse you… in full – maybe even with an apologetic premium. His e-mail is Ryan@DontBetOnIt.com.
Throughout the week I’ve talked about my Sunday afternoon spreadsheet. It’s the foundation upon which I build my weekly outlook. The version we’ll now explore is geared toward 4hr/daily chart traders, but with some elbow grease it’s easily adaptable to whatever timeframe makes you the most comfortable. I’ve also lumped in some aphoristic insights from one of my favorite authors because I think they help frame the type of mindset a trader needs if they are to survive the market’s many brutalities, ceaseless undulation, and total lack of empathy.
“It did what all ads are supposed to do: create an anxiety relievable by purchase.” – David Foster Wallace
Besides being tools, albeit unintentionally, indicators and data points function in the market as ads do in retail. They flaunt the strengths and weaknesses of their products. An RSI in the low teens begs you to purchase a currency that is currently on the clearance rack. An auto consumer’s challenge is to wade through a vast sea of near identical vehicles and pick which one presents the best value and best suits their style of transportation. My weekly spreadsheet, consisting almost entirely of different RSI data, is my version of a consumer report booklet. Take a look.
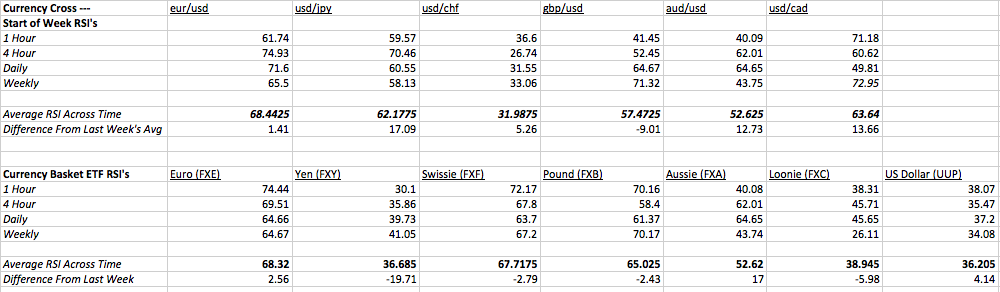
Data Compilation Chart
This one is from a couple weeks ago. Let me explain what you’re looking at. I take 6 of the more popular crosses and compile their RSI’s from each of the 1, 4, D, Weekly time frames. I average them out and note the difference from the previous week. Lately I’ve been working on weighting the average toward the timeframes I trade on without overly distorting the data. This chart is a straight average because I haven’t worked out the weighting kinks yet.
Next I use popular single-currency ETFs and pull the same RSI data for them. I do this to give a better picture of each currency overall because these major crosses sometimes deviate substantially from the tangential pairs.
There you have it – we’re in the middle of Times Square. To me that spreadsheet is nothing more than flashing lights and billboards. Next I look for the fine print.
“The most obvious, ubiquitous, important realities are often the ones that are hardest to see.”
It’s hard to see the signal through the noise but charting and organizing multitude of data into digestible bites is the first step.
I like to look for trends in the “Difference from last week” and average RSI columns. Which currency is near the end of it’s run down or up? Here we see the Euro and Swissie ETFs nearing overbought territory. Likewise, the US and Canadian Dollars (and as usual, the Yen) are nearing the oversold area. Building on that information, I look to the individual crosses.
Where can I find an overstretched Swissie pair or perhaps a badly whacked US Dollar pair? Oh look, USD/CHF’s average RSI is floating barely above the oversold mark with the 4-hour already below it. Now that I know this pair has reversal conditions ripening, I dig into the economic data, look to the upcoming week’s releases, expectations, scheduled news conferences, potential headwinds and so on. (Another spreadsheet I’m working on is a Bayesian formula to evaluate the importance of news releases and economic data points. In theory it will be perpetually updating itself.) Then it’s off to draw resistance and support lines to find strong entry and limit points.
I don’t have the time to comb through the ForexLive comments from weeks ago to find this, but you’d see I called a pop to above 88.20 in USDCHF from near the lows. Although I should confess to getting in too early and barely avoiding being stopped out. A dumb mistake bailed out by solid research and some old fashioned luck.
That’s that. What methods do you all use to interpret data? I’d love to hear as I’m sure some are creative an entirely outside the ability of my own imagination.
I want to end with two more David Foster Wallace quotes.
“You will become way less concerned with what other people think of you when you realize how seldom they do.”
I’ve continually improved as a trader because of already accomplished traders thoughtfully critiquing me and guiding me forward. It’s been tempting to lie sometimes about poor decisions because I don’t want them to think badly of me. How arrogant – they rarely have the time or desire to think of me. It’s more beneficial to be honest.
“It’s probably hard to feel any sort of romantic spiritual connection to nature when you have to make your living from it.”
When you’re trading in your free time or just part-time there’s a certain allure to full-time trading, whether independently or for a big evil institution. Some of us are cut out for that, but total immersion isn’t for everyone and might mess with your trading mojo. Substantial sums of money can be made part-time and that’s better than losing money full-time. You know your strengths and weaknesses: if your strength is trading full-time, do it; if it’s part-time, do that. Trading is about turning a profit and nothing else.
Thanks again for the conversations this week. I’ll continue to be around in the forums stealing your wisdom for myself. Get outside this weekend and enjoy the sun. Unless you live somewhere freezing, then start looking for property in South Florida.
Happy pipping, everyone.

