
If there’s one market that loves and respects the tech levels it’s oil and Brent is the perfect candidate.
I’m my previous posts I highlighted the 108.32 level and the break has been decisive and we’ve pushed up nearly $2. The break has has turned the level into support alongside the 100 dma. The move has pulled up just shy of the Feb 2013 resistance line at 110.29.
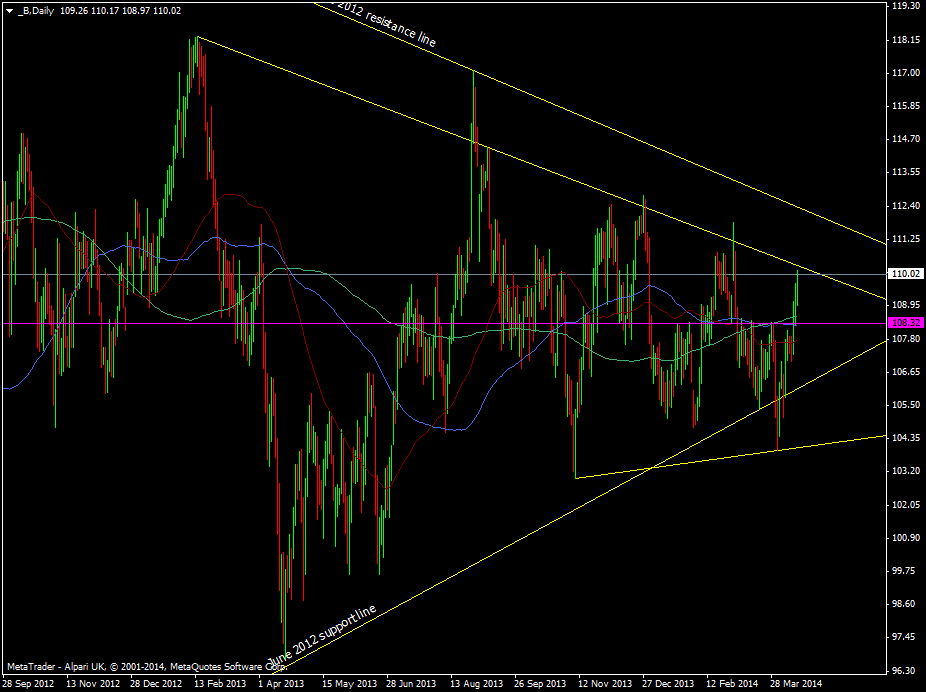
Brent crude daily chart 16 04 2014
I like the tech here so have taken a small short which I’ll look to add to ahead of the higher Feb 2012 falling trendline currently at 112.38. The Dec highs around 112.50/77 are also points of decent resistance.
The Feb 2013 and June 2012 wedge is closing so we have the possibility of a break one way or another. I think there’s still time to trade the edges but with increasing caution. While this market likes the tech in a calm trading environment it also loves to rip peoples faces off now and again.

