
It’s been a week since Draghi took a sledgehammer to the euro and it’s been a one way street down since then. Such are the bounces the cat is not only dead, it’s been buried 6ft underground and had a new tower block built on top of it.
So where do we look to for the bottom of these moves. 1.30? 1.25? That’s getting into fiction land but we’re going to stop somewhere.
The first strong point I’ve looked at previously is the 1.3480 level which marks the 55 wma and historical S&R point.
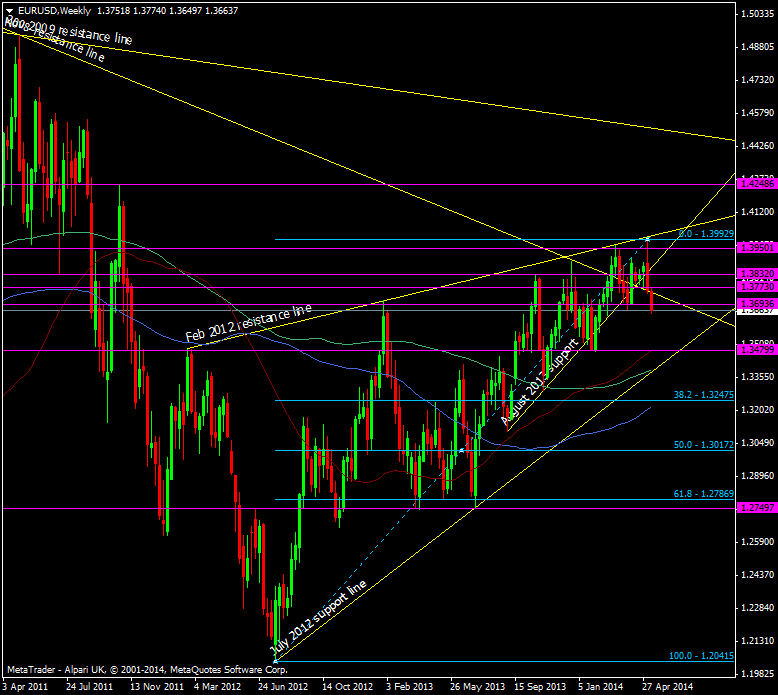
EUR/USD weekly chart 15 05 2014
On the tech front it’s looking a fairly strong level and one I’d be looking to take a long from. Ahead of it though we have the 100 mma at 1.3564 and given the time of the month and the current price might have a something to say in affairs as we run up to the ECB meeting.
Under those levels we have another strong one around 1.3385/400 from the July 2012 support line and 200 wma.
Closer to home I’ve mentioned that 1.37 will be hard work to re-gain and after that we face the the 100 dma and 2008 trendline at 1.3739/48. Below we have the 200 dma at 1.3620 and no doubt there will be plenty of action at 1.3600 if we have a look.
At the moment there’s no signs of the selling abating but after a week of it we should be on guard that what the ECB may or may not do will eventually be priced by the market.

