
The CPI data should put aside any last fears from the BOC about falling inflation and a further drift to the upside of the target range may seen them becoming a little more hawkish. Like everything it’s something to watch closely over the next couple of months to see if we’re going to start seeing a trend in inflation. Looking back at the chart on the data release post there’s signs that that may be happening. Potentially that could mean we might be seeing a top here in USD/CAD.
At the moment we’re still playing within the defined boundaries for 2014 but the trend has been down from the highs.
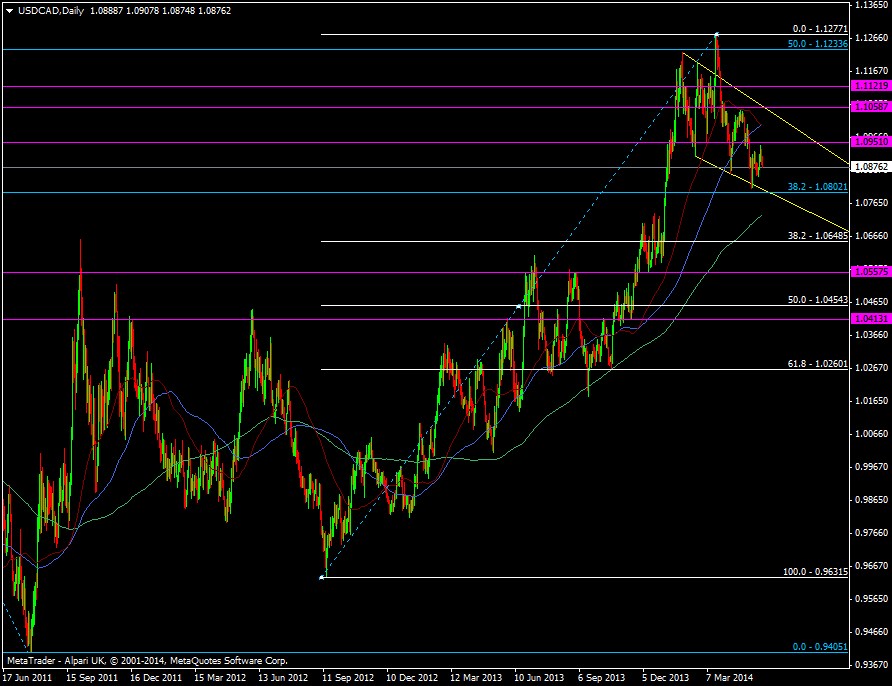
USD/CAD daily chart 23 05 2014
I’m liking the topside for a short and particularly from the convergence of the 55 and 100 dma’s at 1.1001/08, up to the resistance line at 1.1060. I like trading an inflation picture as it tends to trend for long periods. Once the underlying factors align then it lights the touch paper for direction. If you can read the signs early enough you can position yourself nice and early. Usually there’s not a lot central banks can do about inflation bar throw rate moves at it which usually only tend to slow it rather than change it. It’s a constant firefighting battle.
The risk to a short strategy comes from the US and how and when it moves on rates. It’s a slower beast than Canada though so the syrup swiggers might find they are acting ahead of their mates down south.

