
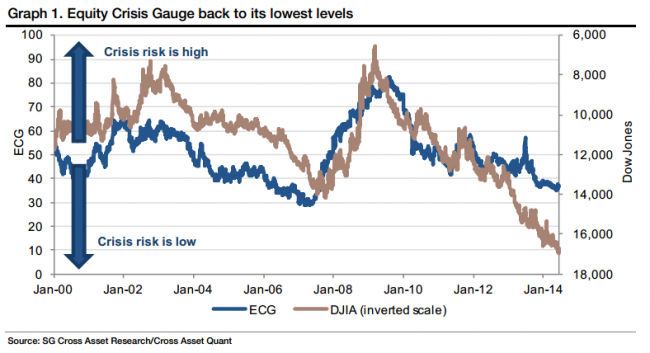
Société Générale’s Cross Asset Quant Research team first presented their Equity Crisis Gauge (ECG) in June 2012; it is an indicator of stress in the global economy and financial markets. When it is at a low level it indicates little chance of a crisis in markets, and conversely a high reading is indicative of markets under a lot of stress. Sort of like quantifying a global butt-clench.
It is now at a very low level
SG say it is close to levels last seen in (northern hemisphere) summer of 2007, with the Dow above 14,000 and credit markets beginning to feel the end of the subprime bubble
Far from being complacent, though, SG asks:
- Is this time different? Financial exuberance vs economic moderation
SG say that the ECG makes use of 12 indicators, 5 of them macroeconomic indicators (GDP, inflation, PMIs, confidence, price/earnings) and 7 market variables (volatility, credit, funding, gold/equity, commodity/equity, real rates, rates slope).
They note that all the ‘market indicators’ are low, like they were in May 2007 lows (except for the funding indicator and the rates slope which are higher), while all macroeconomic indicators are higher (i.e. indicating higher stress) than they were in 2007.
In summary they say this time is different:
The recent and on-going hunt for carry by investors globally has greatly helped the compression of all-risk premia – whether volatilities or credit. With equity prices in the US at record highs, current financial exuberance is reminiscent of early 2007. This time is different with global macro indicators lagging behind.

