
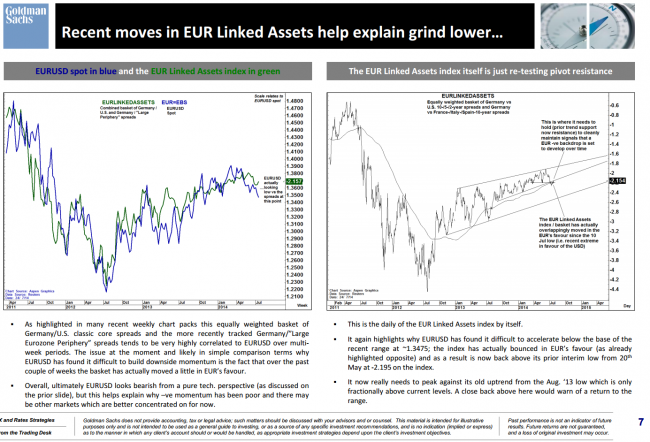
From Goldman Sachs ‘The Charts That Matter Next Week’ (dated 24 July) their TA charts on EUR, with short-term and long-term views, technical analysis charts on EUR/USD and charts on EUR linked assets:
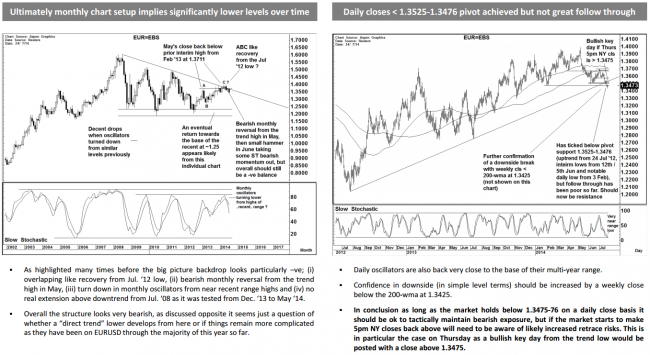
- On their “short-term” horizon (less than 1 month), they are “Neutral”: “Momentum is at range lows and recent candle patterns have appeared exhaustive. Seems a correction is likely due”
- On their “long-term” horizon (greater than 1 month), they are “Bearish”: “Underlying structure looks very negative. may be a “post summer event” but ultimately looks like heading for 1.25-1.20″
Click on the pic for a larger view.
Also:
What are your thoughts on EUR in coming days and weeks?
–
The report also takes another look at the Kiwi – you might recall I posted last week on a special report done by Goldman’s ahead of the RBNZ announcement in which their TA people had turned quite bearish: Goldman Sachs asks “NZD Weakness Due?”

