Just last week the S&P had thoughts of breaking to the downside and dipping below 1900. Though it looks like Yellen’s careful words and geopolitical risks will prevent it, this week had, for a time, intentions of cresting 2000. Whether we like or not and whether we consider it as often as we should, the Forex market, commodities, debt, and equity markets are all cogs of the same machine and not different games in a casino for those simply with different tastes. So, currency traders should be cognizant of the current state of the equity market. Doing my best to avoid extracurricular commentary, here’s equities as I see them.
If you watch business television or read any popular business websites you’ve heard this more and more:
- “The market is overvalued based on every fundamental measure of stocks therefore this bull market will end.”
- “The market has gone up for too long and therefore must come down.”
- “Irrational exuberance has returned and we are reliving the 1990’s.”
The problem is that valuation metrics are terrible at predicting stock market movements and just like investment managers reaching for yield, business journalists are reaching for a chart that drums up fear (and therefore click throughs). Recessions kill bull markets, they do not simply die old age.
Mean reversion is the trump card that everyone can play as an excuse to disregard the entire picture. “We are above historical indicator X, therefore we’re due to come back to the historical mean.” Those who play this card fail to give credit to the fact that something can stay above its mean for extended periods of time with no law-like pressure requiring it to descend. There are other ways in which the stock market can reach its long-term average without having to crash. For example, the stock market may deliver below-average yet positive returns for a prolonged period of time until the mean has been reached. No one wants a market to return 2% until data returns to its long-term averagee, but it can, more slowly, achieve that result sans a crash.
Aswath Damodaran made the point well when he said,
“If cash flows increase, growth rates surge, risk-free rates drop, or macroeconomic risk subsides, stocks should go up, and sometimes steeply, and there is no bubble. At the other end of the extreme, if stock prices go up as cash flows decrease, growth rates become more negative and risk-free rates and equity risk increase, you have a bubble.”
All I’ve accomplished so far is to point out that despite the news and certain indicators it is possible that we are not overvalued and due for a crash. That is not the same as arguing that we won’t crash. The takeaway is that averages are only marginally helpful and if you are trading and not in a long-term buy and hold strategy, they’re less than useless in the short term.
Just look at the volatility of the very popular P/E valuation idicator:
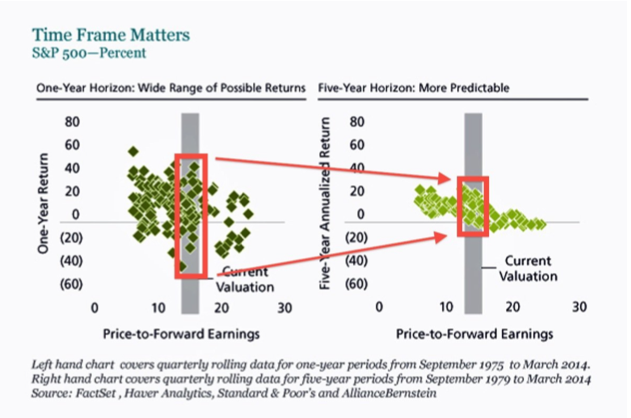
Now lets turn to the current state of the equity market. There are a few data points that actually can help situate us historically. Again, if you’re trading on a daily chart or lower, they might not be helpful today but it’s where the market wants to head. Here’s a few visuals.
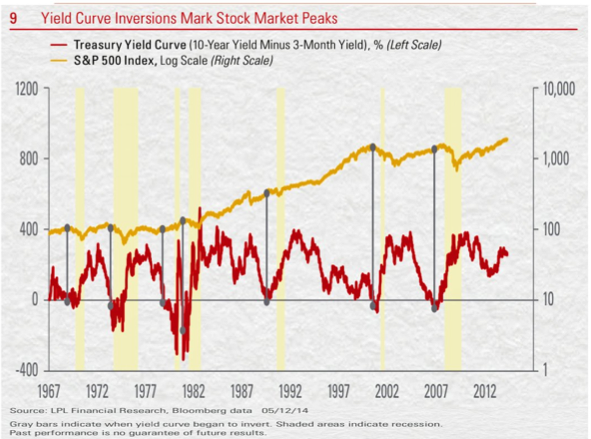
The yield curve becomes inverted when short-term interest rates are higher than long-term interest rates. It’s happened heading into the last 7 recessions for the past 50 years. The inversion leads a recession by an average of about 12 months but lead times range from 5 to 16 months. How far the Fed must push up short-term rates before the yield curve inverts by 0.5% depends on where long-term rates are. Even if long-term rates stay at the very low yield of 2.6% seen in mid-June 2014, to invert the yield curve by 0.5% the fed would need to hike short-term rates from around zero to more than 3%. Based on the latest survey of current Fed members that vote on rate hikes, they do not expect to raise rates above 3% until sometime in 2017, at the earliest. Recently it seems the time frame for rate hikes has come forward, but even if it happens sooner than later there’s no indication they will raise quickly. In fact, a slow upward drift of rate hikes is the main impetus behind the recent hawkish Fed speak.
Ok, quick recap again.
- Most indicators of market tops/downturns are garbage.
- P/E does become somewhat more helpful is you zoom out five-years, which isn’t that helpful for traders.
- Yield curve inversion has, in fact, provided a solid leading indicator to bull-killing recessions. We are not yet near the inversion point.
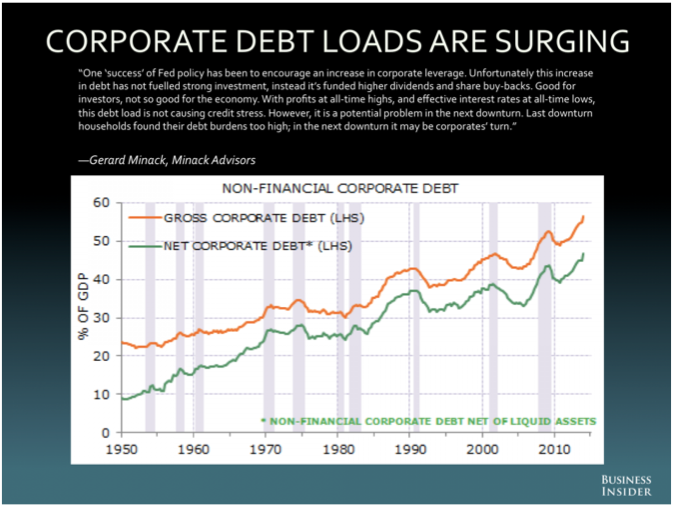
There is one reason in particular that everyone believes is driving the market into bubble territory and it’s the Federal Reserve’s monetary policy. Interest rates have remained extremely low for years to encourage lending in hopes to spark economic growth due to the recession and excess liquidity has been pumped into the markets through their asset-purchasing program.
Many think that this easy monetary policy is the only thing propping stock prices up and that when QE ends and rates begin to hike, it will all come crashing to the ground. It’s not a stock-price-positive, but it’s also too anemic of a view to stake your wealth on.
The most important trend in this bull market is this: easy monetary policy has lead to increased lending which corporations have been using to fund stock buybacks and M&A activity rather than investing in the organic growth of their businesses.
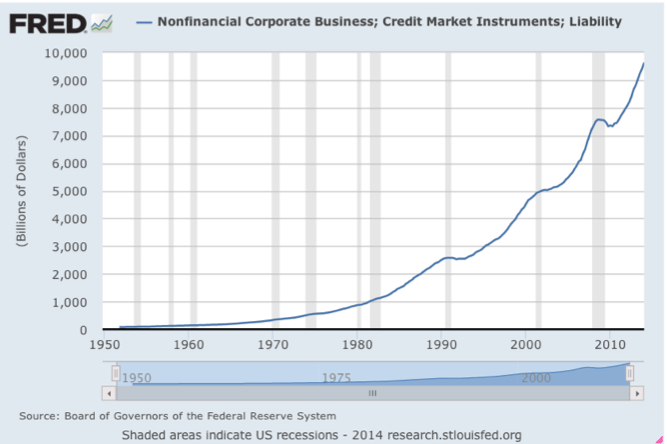
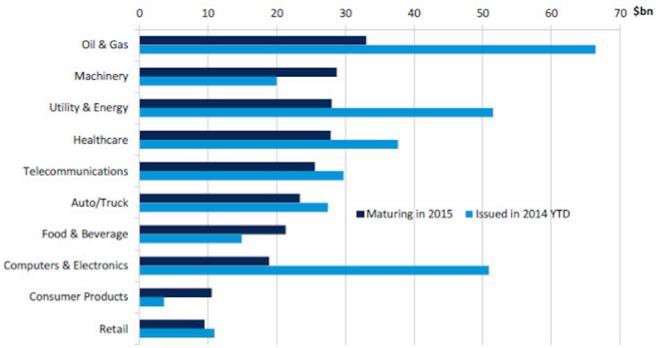
Massive amounts of corporate bonds have been issued in the last few years and this chart breaks the debt down by sector. The large amounts of debt in the oil & gas sector are mostly on the back of the fracking boom, which needs large amounts of cash to continue production.
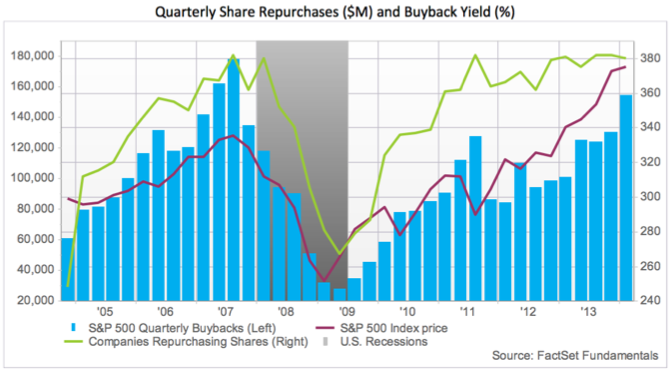
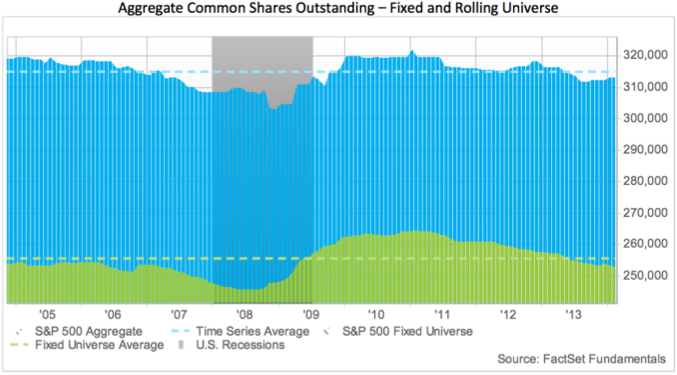
Buy back’s decrease stock supply and when coupled with dividend increases, significantly drive up demand and therefore stock price. This could lead to a liquidity problem in the market when this big driver in the market begins to slow and the mountains of recently issued debt creep nearer to maturity. The first chart below show the amount of share repurchases over the past few years along with the S&P 500 returns and the amount of companies repurchasing stock. The second chart displays the total amount of shares outstanding in the market and shows that total shares are below average levels.
That is to say, stock prices have, in many cases, been engineered (manipulated?) to move higher. Furthermore, corporations have boosted earnings through widening profit margins by cutting costs while revenue growth has lagged. There will come a time where margins, which are currently at all-time highs, will no longer be able to expand and revenue growth will need to take the wheel for this bull-market to continue.
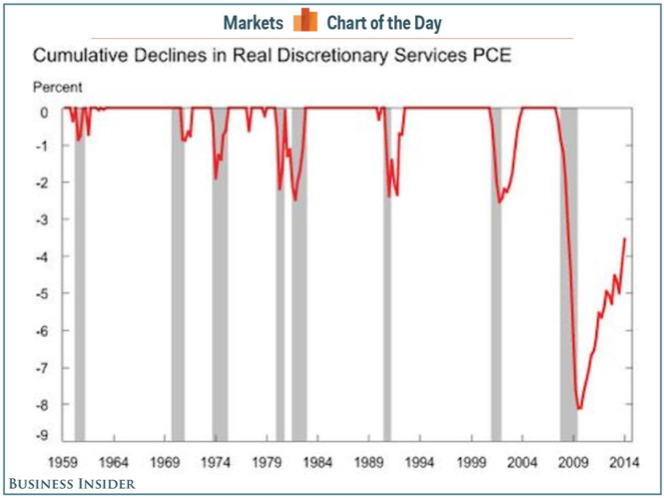
The last bit I want to touch on is the consumer. Real wage growth has been stagnant and therefore spending especially in discretionary services has been anemic in the recovery. The chart below shows how far discretionary sales is off of making new highs and is by far the biggest laggard in the recovery.
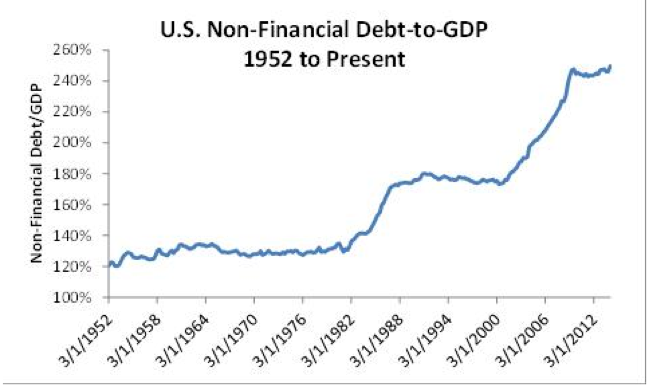
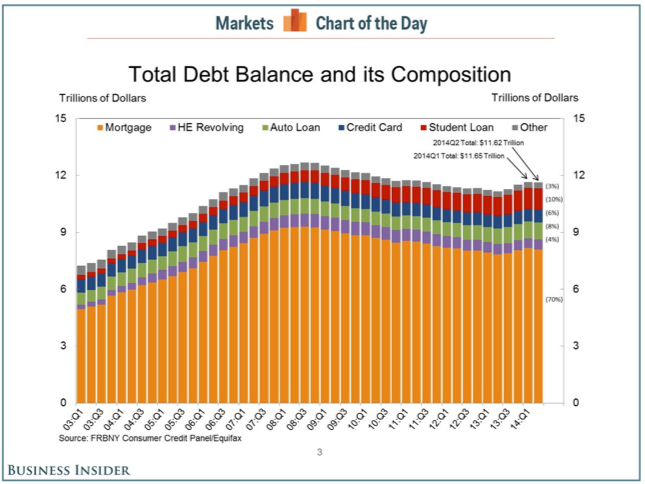
Along with slow wage growth, the average consumer is still burdened with plenty of debt. The next two charts display this well.
The picture painted by all of this isn’t what I’d call rosy. But, just as much, it’s not pointing to impending doom either. To me the picture of equities seems fragile. The S&P could just as easily continue hitting new highs as begin a descent. It all depends on how the Fed handles itself at the end of QE and geopolitical risks, of course, but more important, I think, is how corporations who are sitting on mountains of newly issued debt and stores of cash, and the consumer decide to act from now on.
As stated before, rising wages can mean increased spending but those wages have to be paid out by the companies.If corporations finally begin engaging in capex and spending to grow organically instead of engineering financial growth, and if they contribute to real wage growth for their employees, then there is no reason why the market cannot melt higher. Capex has become something of the market’s unicorn, though, so I’m not going to pretend an uptick in capex spending will happen.
So, the final recap.
- Most indicators of market tops/downturns are garbage.
- P/E does become somewhat more helpful is you zoom out five-years, which isn’t that helpful for traders.
- Yield curve inversion has, in fact, provided a solid leading indicator to bull-killing recessions. We are not yet near the inversion point.
- Corporate debt is getting and has gotten out of hand.
- Stock gains are largely due to financial engineering
- Financial engineering has left the market poised on the edge of a serious liquidity problem.
- Without the consumer, who is still riddled with debt, finally earning (and then spending) higher wages organic corporate growth will likely prove elusive.
- No capex, no organic growth.
Where am I positioned, personally and professionally? I’m long stocks just the same, although, I believe the tapering has finally provided the opportunity to take strategic short positions so I have and will continue to do so. The market’s become choppy and there’s no reason just yet for it to smooth out up or down. That means letting good companies work and taking out tactical shorts is the most prudent style. And, of course, being patient. No need to be in any position if you’re devoid of conviction.
Well? What how do you all see it?

