
The forex markets are a bit “dull” on a Friday afternoon, so why not have a little fun by looking at shares of TSLA.
There are reports that Tesla’s Elon Musk calls his own shares a bit high at the moment. He does this from time to time. Of course it is easy for him to say given his wealth.
Nevertheless, the stock has been on a run, and so I thought I would take a technical look at TSLA using the same technical tools I use to analyze the forex market. The goal is to see if the “smart” equity traders use technicals to define and limit their risk. I also want to plan out an area where patient buyers might want to reenter on the dip.
Elon Musk says Tesla is too high now. What does the price and tools tell me?
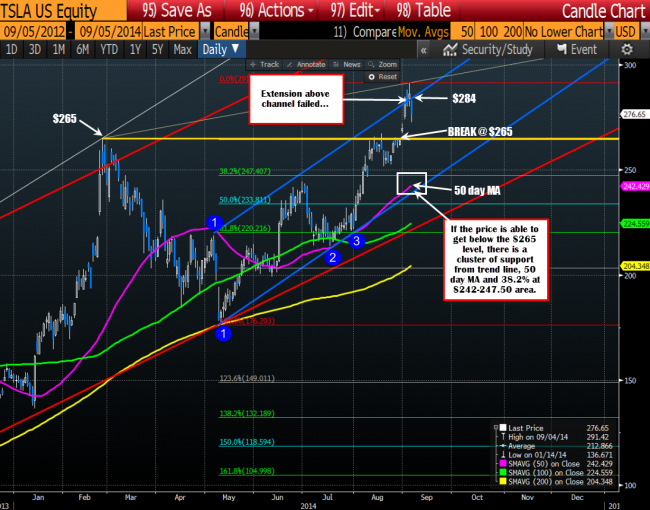
Looking at the daily chart above, the price over the last 5 days broke above the prior high of $265 from end of February 2014. The correction at that time, took the price all the way down to $176 in May. That is a hefty 33% decline. Remember, this stock is not for those looking to collect dividends. It is all about trading.
The rally since the May 2014 low has taken the price from $176.20 to the high reached yesterday at 291.42 or 65% higher. Not a bad gain for 4 months.
With Elon Musk saying the price is too high, there is room to correct. Let’s take him for his word. So where too? Where should I look to buy a dip?
Looking at the daily chart the first support target becomes the $265 break level. The market gapped above this level just last week. Where there is a gap to fill, that creates the obvious first target.
Is $265 enough?
It might be, but we were just there last week. So let’s be more patient and look for a lower level to stick our toe in the TSLA water.
On a break below that level, traders will likely next be looking to buy in the $242.00 to 247.50 area. This is where the 50 day MA (the top purple line is found), trend line support ( blue trend line), and is between the 38.2-50% retracement area of the move up from the May 2014 low. This cluster of support should be nice level for traders to buy with a stop below the 50% area at $233.81.
A move to this area would represent a decline of 14.9% – 16% from the high to the area. It sounds like a lot but given the 65% run up, maybe not if traders got a little offside. Plus, we were last there just a month ago, so again, it is not out of the question.
Does the same technical tools I rely on for my daily forex analysis – Trend lines, 100 and 200 day MA and Fibonacci Retracements – apply to stocks?
The one thing I add to equities is a 50 day MA. Stocks tend to move higher over times (they have an upward bias) so I find the 50 day is needed – especially for those stocks that are trending.
If you take a gander at the chart above, note how “the market” used the trend lines and MAs to define and limit risk (the three simple moving averages are 50, 100 and 200 day from top to bottom). There were some nice levels where traders could buy, with risk defined and risk limited. That bounce off the 200 day MA in May was particularly a perfect test and perfect bounce. You have to know it is there to take advantage of it.
There were other times along the way, when traders/”the market” used the 50 and the 100 day MA as well.
The lesson is, that smart traders in all markets will look to use technical tools to define and limit risk. If you do too, you may find that you can not only define and limit risk but may also be able to improve trade location – even in those high flyers like TSLA.
It is all about RISK. Look for dip against the risk defining levels. They tend to find other “smart” traders, looking to do the same thing.

