
In the prior post on the AUDUSD, I wrote:
Needless to say, the question now is “Will the 8th test [of the 0.9201-36 area] be the one that breaks out to the downside?”. If so there is another line of defense for the buyers against the 200 day moving average (green line in the chart below) and the 38.2% retracement of the move up from the 2014 low to the 2014 high. That level comes in at the 0.9181 area. A move below it should trigger additional selling with the 0.90817 level as the next key target (50% retracement of the same year’s trading range).
Well, the market did break below the 0.9201-36 area, but the momentum could not get below the support from the 200 day MA and the 38.2% retracement level (see chart below).
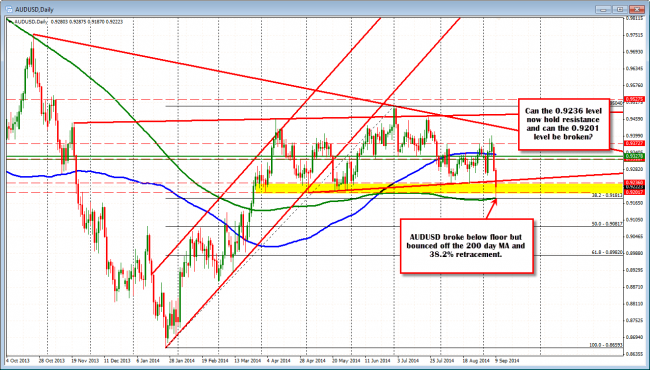
The AUDUSD holds support at the 200 day MA and 38.2% retracement support and bounces.
What now?
With the move to new lows, the retracement of the trend move down has moved the 38.2-50% of the move down also lower on the 5 minute chart (ie. risk defining level -see 5 minute chart below). That area comes in at the 0.9225 to 0.9237 area. The 50% corresponds with the floor area on the daily chart. So for me, that remains a bull/bear borderline that if the shorts have a chance, that is the line in the sand that the price should now stay below.
In a perfect world, the break below the 0.9201 level would have led to a trend move lower. Unfortunately, the other key support against the 200 day and 38.2% retracement level got in the way. Now with the correction, the original battle from the prior post is being fought again between the 0.9201 and 0.9236 level. Pick your weapon, pick your side and hope the market agrees with you. I will give the benefit to the move today, but will give in to the wishes of the market if it decides otherwise. Lets rumble.
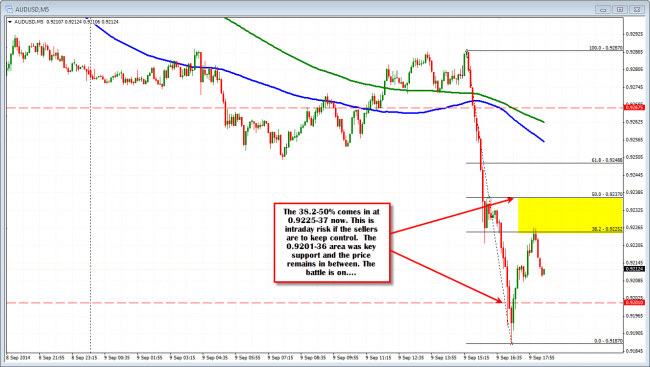
AUDUSD 5 minute chart showing resistance at the 09225-37.

