
The USDZAR has broken above topside trend line and the 50% of the 2014 trading range at the 10.8149 and 10.82965 levels. The move higher took the pair out of an ascending triangle formation. For me, a break above any strong trendline/combined with the break of the 50% retracement is bullish. The market thought so too, and the price has raced higher.

USDZAR breaks above 50% and trend line resistance.
The next major target looking at the daily chart is the 61.8% of the same year trading range. That level comes in at the 10.9616 level. The high has reached 10.94605. Approach that level and there should be some profit taking – at least on the first look. Nevertheless, the bullish move over the last week is impressive and the technicals have been fully supporting the move. The price based against the 100 day MA (blue line in the daily chart above). It held the 200 day MA (green line above) on Friday and Monday. Today was the break above trend line and 50% level. Impressive.
Looking at the 5 minute chart, the move higher over the last 2 days has been quite steady and predictable. Traders used the 100 bar MA (blue line in the chart below) to define and limit risk (see blue circles in the chart below). The most recent correction off the high has been the deepest correction of the move. The price moved below the bottom trend line (see green circles in the chart below). However, true to the pattern, buyers emerged against the 100 bar MA and the 38.2% and the price is back higher.
Going forward momentum is slowed but support is holding. I would expect traders to lean against the MA line until it does not work. So on a break be cautious. Think in terms of correction/consolidation instead of trend.
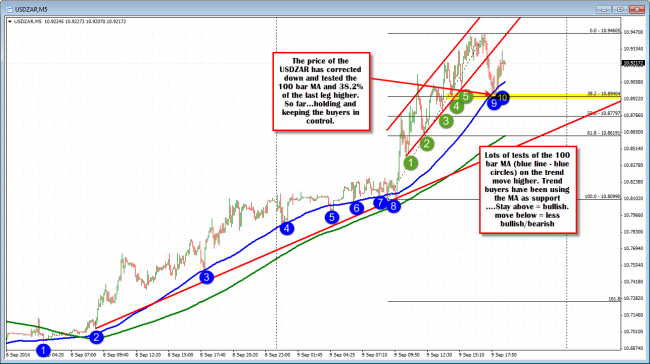
USDZAR finds support a number of times at 100 bar MA. Momentum slowing though.

