
- GBP-9.4 bln prev
- non-EU GBP -4.345 bln vs -3.6 bln exp vs -3.84 bln prev
- total trade gap GBP-3.348bln vs -2.3 bln exp vs -2.5 bln prev
- exports +2.1%
- imports +3.9%
Widest trade gap in over two years after a large increase in imports swamped the effects of a modest increase in exports. The data shows that a mix of weak Eurozone activity and strong domestic demand are hampering Britain’s attempts to find an economic balance to sustain any recovery
I’ve highlighted this trade deficit on many occasions previously as a cause for concern and with GBP enjoying heady days in that month our importers will have obviously enjoyed it more than the exporters.
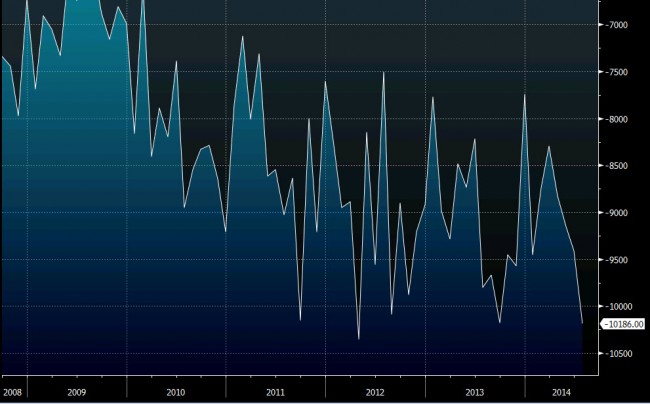
UK visible trade deficit mm

