
The EURJPY hit a wall on the daily chart today when the price reached topside trend line resistance at 138.49 and moved just above the 100 day MA at 138.39 The high reached 138.50. The two risk defining levels were too much to pass up for profit takers/seller (along with perhaps some comments from BOJ Kuroda) and the price has rotated lower. It is trading just below the high from September at the 138.26 (see daily chart)> That level along with the 137.99 are the support levels to eye on the daily chart going forward. The 137.99 was the high closing level on two separate days in September. It also was high price in the month of August. The buyers/longs will like to see this area hold on a correction. While the sellers against the resistance above would want to see the opposite.
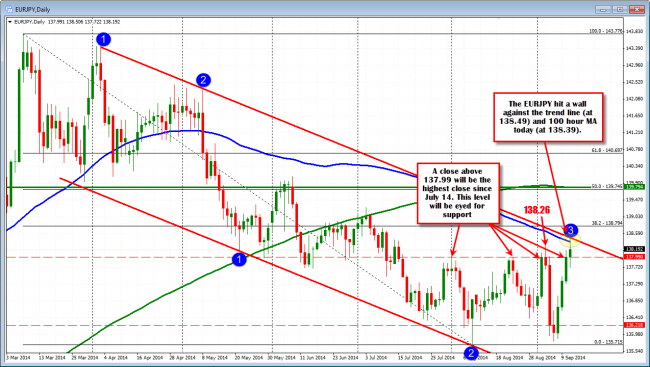
The EURJPY ran into a wall against the 100 day MA and topside trend line at the 138.38-49 (high reached 138.50)
Looking at the hourly chart, the pair is tracking a nice trend line from the lows from Monday. The move to the upside has retraced the damage from the move down last week (and the little extra today). It is a key moment to see if the buyers can keep the move going into and through the final day of the week.
I would guess that if polled most would say, the USDJPY and EURJPY has gone too far this week but that is what you expect to hear in a trending market
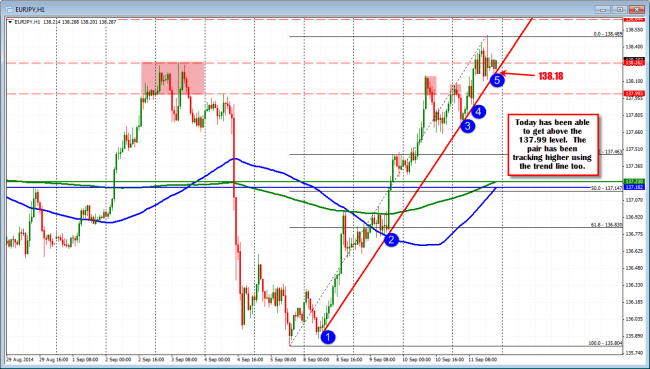
EURJPY tracks trend line. Trying to get a close above the 137.99 level today.

