
The NZDUSD is opening in the NY session banging against the key topside trend line at the 0.8155 level.
The prices tested this topside trendline no fewer than 7 times over the last 6 or so trading days (see hourly chart below). A break through the level would look toward the 0.81949 area where the high from Friday’s trade and the 100 hour moving average (blue line in the hourly chart), are both found..
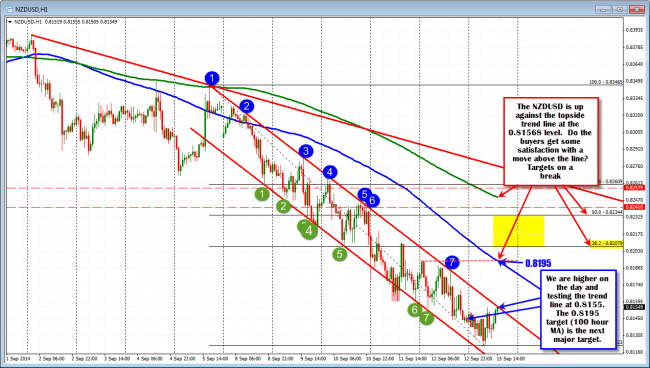
NZDUSD is testing the topside trend line once again. A break will target the high from Friday and the 100 hour MA at the 0.8195 as the next major corrective target.
The pair is higher on the day (bullish), and also found support against the 61.8% retracement of the move up from the 2013 low to the 2014 high (see daily chart below). Holding the support level against the Fibonacci retracement, has given the buyers more confidence and could give the pair the push needed to get through that trendline and correct further to the upside. The 0.81949 target level is certainly not out of the question as it was just Friday when the price traded at the level. Look for the buyers momentum to increase should the price break above the hourly trend line.
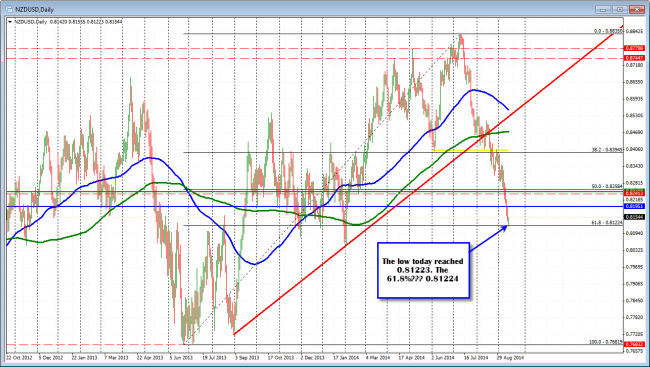
NZDUSD tested and held against the 61.8% retracement level in trading today.

