
The USDJPY is moving to new lows after the weaker Industrial Production/Capacity Utilization. The pair had previously created a pretty strong ceiling against the 107.38 area (see hourly chart below). The high was reached on Friday against topside trend line. This trend line had a number of tests on the way up, but no breaks.
That high at 107.38, then became a level to lean against by the sellers – and the ceiling has been formed. The next target for the pair off the hourly chart comes in down at the 106.87 level which is the 100 hour MA in the chart below (blue line). The price has not closed below the 100 hour MA since September 5th when the price bottomed at 104.67. Before that, you have to go all the way back to August 29th (the low on August 28th was 103.54). The pair has had a nice run of it. Is it time to consolidate/correct?
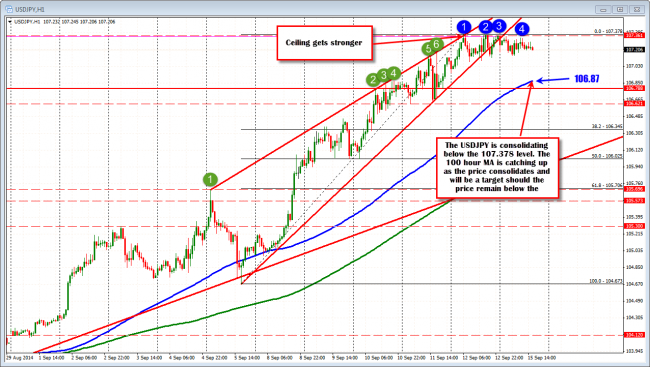
The USDJPY has created a strong ceiling at the 107.38 level (RISK). The 100 hour MA at 106.87 is a target for traders today if the bears remain in control.
Looking at the weekly chart below, the price action is suggesting a top as well. The pair has not been able to extend materially above topside trend line (at 107.30 today), and this too may contribute to a corrective move for the pair. I spoke about this ceiling in the weekend technical review and preview (see: https://www.forexlive.com/blog/2014/09/13/usdjpy-technical-analysis-keeps-making-6-year-highs/ ). From both the intermediate hourly chart and the longer term weekly chart, there are reasons to anticipate a correction lower. What is the risk?
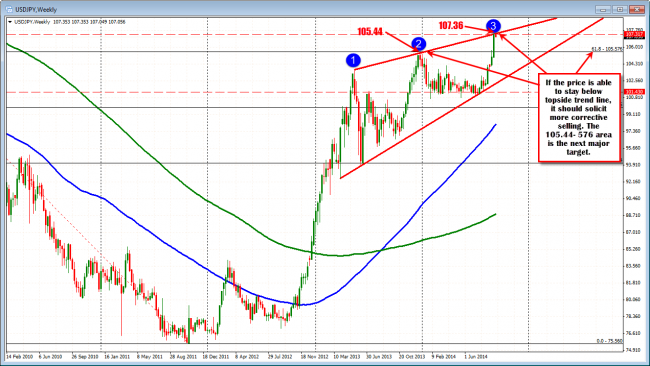
USDJPY has been testing the topside trend line on the weekly chart. This is 6 year high for the pair. A failure and the price could rotate back lower with the 105.576 the next major target.
Looking at the 5 minute chart below, the price has broken to new day lows and is correcting off that level. If the price can stay below the 38.2-50% of the last move lower, this would show the sellers are staying in control. With the topping in the hourly and the weekly, this is the closest risk level for today’s trade (with the 100 and 200 bar MA on the chart below also a potential resistance level). Stay below and the bears remain in control and new lows and a push toward the 100 hour MA can be anticipated. This is the first major hurdle to get to. Below that, look toward 106.62 and then 106.345 which is the 38.2% of the move up from September 5th low to the high reached on Friday.
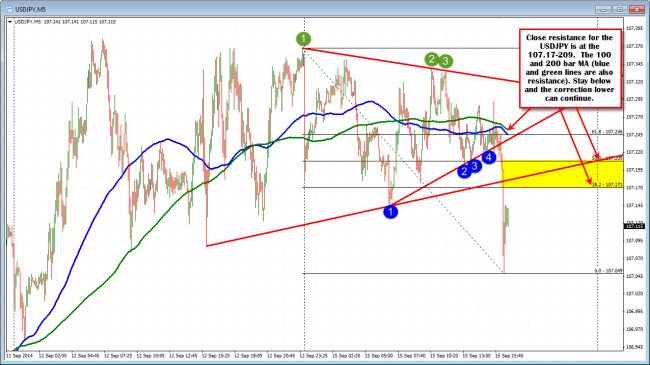
USDJPY on the 5 minute chart has resistance today against the 38.2%-50% o fhte move down at 107.17-209. This is close risk for the pair today.

