
When the 100 and 200 hour MAs converge with price, it says to me “BALANCE”. It says to be “Non Trending”. It says to me. “Get ready for a move away”. I call this condition “Three’s a Crowd” and like the old saying “Two’s company. Three’s a crowd”, someone has to go. In the world of trading, it is the price.
Now it does not take a genius to figure out that this is just the calm before the storm, as the Scottish Referendum is expected to push the GBPUSD sharply higher on a “No” vote, or sharply lower on a “Yes” vote. The odds makers are saying the “Nays” will have hit, but the polls are not so confident. Since fear is often the controlling emotion, the GBPUSD is probably lower than most expected say a month or so ago, but at least the price has found an equilibrium level as we now wait.
As if the vote is not important enough, before the results of that event are known on Thursday, there will be a whole slew of other UK data coming out. Tomorrow the Bank of England minutes will be released at 4:30 AM ET/8:30 AM GMT as will the monthly employment statistics. On Thursday – also at 4:30 AM ET – Retail Sales will be released. Add the FOMC statement and Yellen press conference, and results from the TLRTO first tranche and there is plenty of opportunity for a break away before the “Big Vote”.
You can choose to take a seat, enjoy the show, but not be part of the “trading cast” as event risk is too high. If you want to be in the play, it is important to outline the risk defining levels of importance. It is often tempting to think “such and such is priced in”, but with the uncertainty, I am not so sure what “such and such” is. I would rather let the price action and tools tell me.
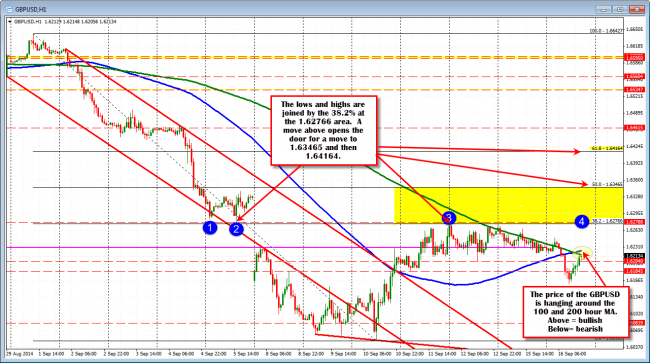
The GBPUSD price is approaching the 100 and 200 hour MA (blue and green lines). A move above will switch the bias to the upside.
On the Topside:
The first bullish clue will come with a move above (and staying above the 100 and 200 hour MAs at the 1.6216 (100 hour MA – blue line above) and the the 1.6223 (200 hour MA – green line in the chart above). That is step 1. A move above gives a bullish bias. A move below, a bearish bias. This is the line in the sand for me as to bias as the event risk becomes known and the traders focus on the “market risk”. From there, I will look for momentum and for the pair to break targets in the direction of the bias.
On a bullish move, the next targets for the GBPUSD above the 100 and 200 hour MAs, comes from highs/lows and Fibonacci retracements.
Looking at the hourly chart (see chart above), the last 7 trading days has seen the price gap lower on the weekend poll on September 8th. The subsequent rise off the low has extended to the 38.2% of the move down from the September 1 high to the September 10 low at the 1.6276. The level is also near the low trading price from Friday September 5th. at 1.6278. As if that wasn’t enough, the 38.2% of the move up from the 2013 low to the 2014 high comes in at the 1.62814 level (see daily chart below)
Needless to say, the 1.6276 – 81 area is a key area for the GBPUSD over the next few days for several technical reasons. Like the 100 and 200 hour MAs, a move above this key area is needed to push toward the next target.
That next target comes against the 50% of the move down from the September 2014 high to the September low (see hourly chart above). That level comes in at the 1.63465 level. Above that level, the next target is the 61.8% retracement of the same move lower (see hourly chart above) at the 1.64164 price.
Those are the progressively higher targets to the upside on a bullish move. Traders can use those levels to define and limit risk on more bullish news and momentum. SImply, move above one level, look for the price to stay above and target the next in a step-by step progression. If it fails, that may indicate the market has found it’s next equilibrium level. Time to consolidate/correct.
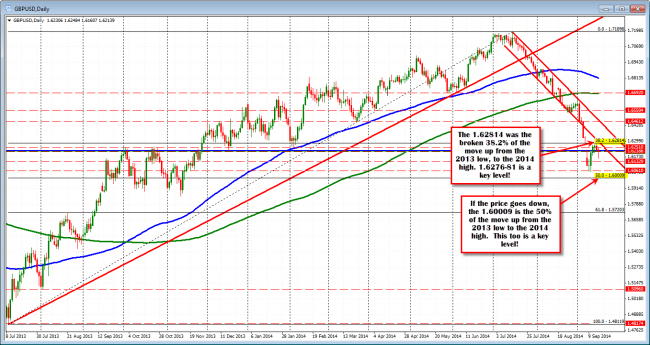
The GBPUSD has resistance at the broken 38.2% of the move up from 2013 low to the 2014 high at 1.6281. The 50% of the same move comes in at 1.6000 and this is support.
On the Downside.
Should the price stay below the 100 and 200 hour MAs (green and blue lines at 1.6216-23), the low from today at the 1.61607 will be the next target to get and stay below. Below that, traders will look toward the 100 week moving average (see weekly chart below) at the 1.6087 level. Last week the price moved below this MA but could not close below.
Stay below the 100 week MA and traders will shoot for the the lows from last week and lowest trading level since November 2013 (down to 1.60503).
Finally, the next key downside target (and perhaps strongest level on a bearish move) comes in at the 1.6000 level. Not only is it attractive because of the importance from the 1.60 whole number, but it also is the 50% of the move up from the 2013 low to the 2014 high AND the 200 week moving average (see green line in the weekly chart below at 1.6004 this week).
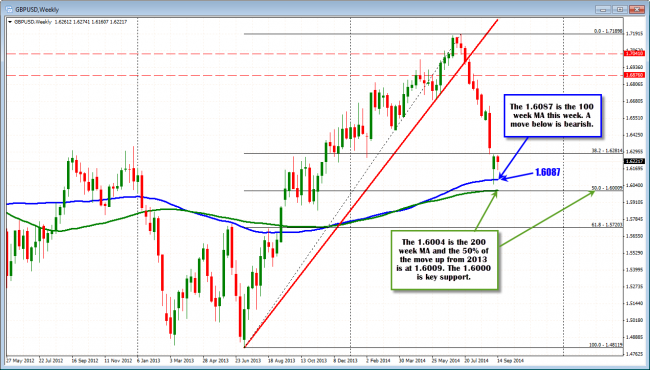
THe GBPUSD 100 week MA is at 1.6087. The 200 week MA and 50% of the move up from 2012 low is at the 1.6000-04 area. KEY SUPPORT.
In Summary
In summary, the price is at a “happy” level now with the price at the 100 and 200 hour MAs. There are key levels above. There are key levels below. Look for the breaks. Look for the momentum. Look for the next targets. And above all, understand before you do anything, that not only are you facing the standard market risk, but you also have heightened event and liquidity risk. SO if you want to trade, be sure you define and limit your risk as it can be a wild ride. If you don’t feel comfortable, don’t trade. There will always be another trade when risk is more comfortable.

