
USD/JPY hit a big level overnight while all eyes were on Scotland. We ran up through 109.00 to the 2002 resistance line at 109.35. We actually broke it by 11 pips but it’s a fail in my book as long term levels never stop on a dime.
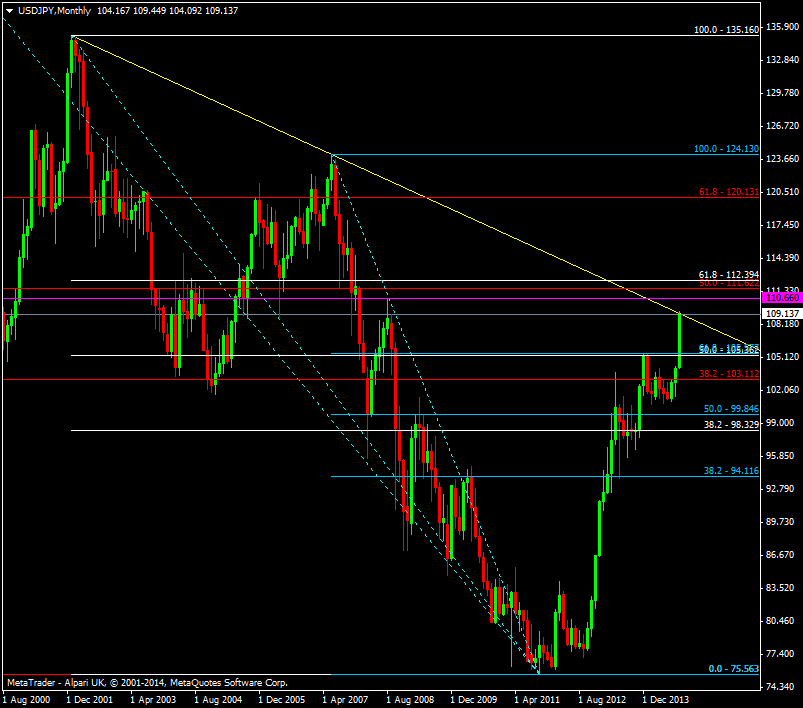
USD/JPY Monthly chart 19 09 2014
At the moment the pari is holding the 109 level rather well and if it continues to hold then we’re likely to get another look up top. Given the week we’ve had I’m not sure that the yen has enough energy to take out the higher level and if we see some weekend profit taking coming in then it will the downside we have to worry about.
On that front the 108.75/80 level will be first support area then 108.60, 108.50 and 108.35. If all that gets smoked and the 108 big figure then we might have some fun and games.
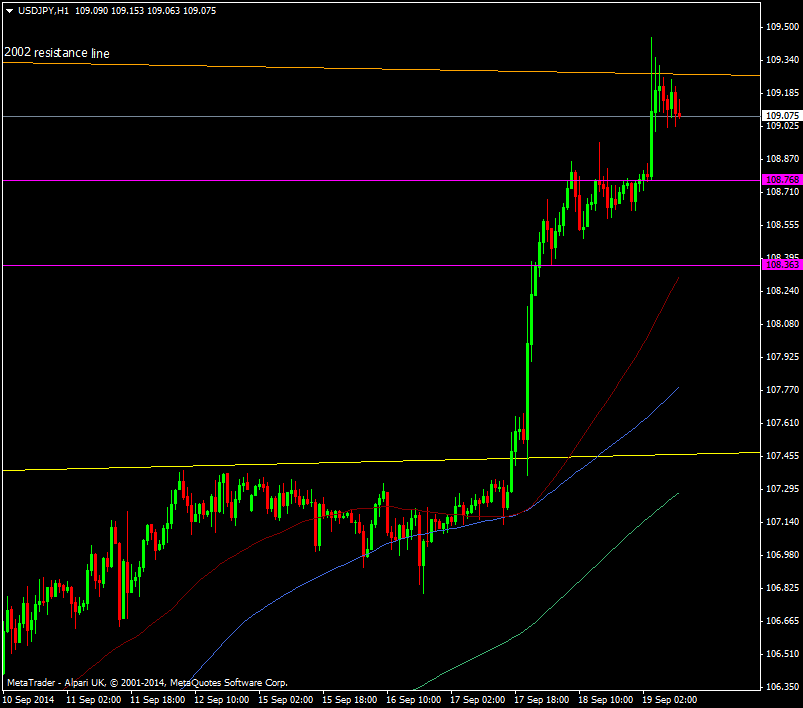
USD/JPY H1 chart 19 09 2014
Ideally the better entry point for longs would be down around the 107.40 area and the May 2013 former resistance line (yellow) and while there’s some minor support levels the next one after is down at 106.02. If we do see some consolidation and a refresh of the trend then these levels will be in focus. Be warned though that a refresh in this pair can be worth 400-500 pips.

