
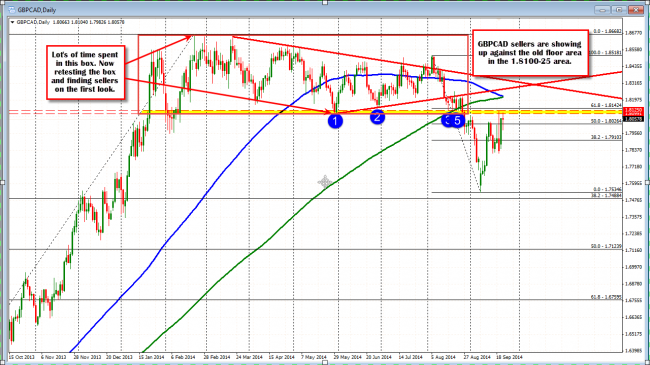
The GBPCAD has been testing old floor support at the 1.8100 area. The high from Friday came in at 1.8117 level. The high today came in at 1.8104. The price is back down at the 1.8050 area now.
Looking at the hourly chart, the selling against the 1.8100-25 is seen. Today there were two tests of the area. If the price bias remains to the downside, the next targets become the 1.79938 (38.2%), the 50% at the 1.79598 and the 100 and 200 hour MA (blue and green lines). On Monday and Friday, the price fell below these MA lines but failed to get below the low from September 16 (double bottom there).
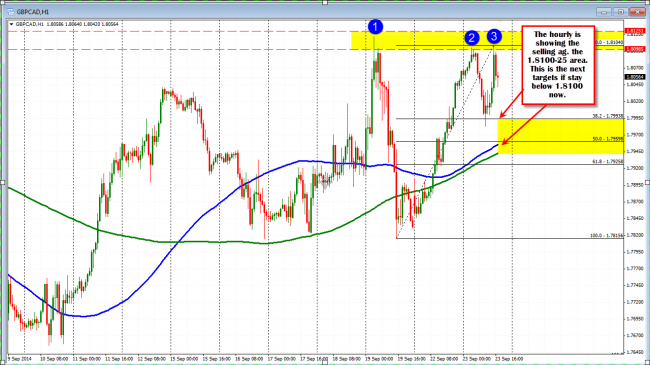
GBPAUD on an hourly chart shows the selling at 1.8100-1.8125 area. The 1.79.93 is the 38.2% first target now.
Looking at the 5 minute chart below, the selling today has taken the price to the 50%. There is still work to be done to call the top. A move below the 50%, the 100 bar MA (blue line) should help complete the “top is in place” picture and potential for a further correction lower toward the targets on the hourly.
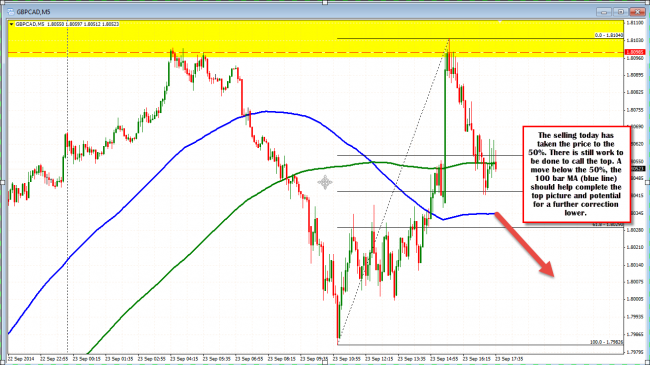
Technical Analysis: the 5 minute chart still needs to get below some levels to complete the picture.

