
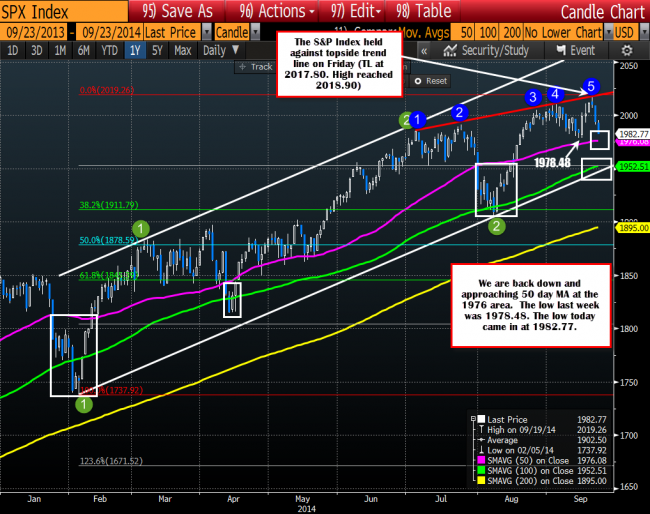
The S&P Index peaked on Friday – the day of the biggest IPO of the year for Alibaba. The price at the high extended JUST above the topside trend line connecting most recent highs. That line came in at 2017.80. The high reached 2018.90, but closed below. HMMM.
On Monday, the price moved lower. On Tuesday (September 23rd) another 11.52 has been shed.
The price is near the low from last week at the 1978.48. The 50 day MA comes in not far from that at 1976.08 (should be a little higher tomorrow).
S&P index is down over the last two days after testing topside trend line resistance and holding. Alibaba goes public on the day too. HMMM.
Is there more to come?
The momentum to the upside is rolling over a bit.
- The highs are higher but the topside trend line is flatter
- That trend line has 5 points along it. It had it’s chance to move above. It could not.
- The moving averages (50, 100 and 200 in that order) are moving higher , but the 50 might be flattening a touch.
Is the picture, I look at off the daily totally bearish?
Not yet.
Yes, if you sold on Friday with the Alibaba hype you are sitting comfortably. However, we are still above the low for the month and the 50 day MA at the 1978.48 and the 1976.08 respectively. Get below those and the sellers will have more confidence and the selling should have more momentum.
Where could we go? The 100 day MA (middle MA line in the chart above) and upward sloping trend line at the 1947 are the obvious targets. The 100 day MA comes in at 1952.51 currently. A move to those targets would represent a decline of 66 – 71 S&P points or 3.26% – 3.56% . Bothered. That is nothing. The correction from July high to to August low, corrected around 4.36% from top to bottom. What next?
A bigger move below the 100 day MA would look toward the 38.2% of the 2014 trading range. That retracement comes in at 1911.79. A move to that level would represent a 5.35% decline. This would be the 2nd largest correction for 2014. The largest correction was a 6.1% decline from the 1850 high reached in January to the February 5th low (at 1737.92).
The next major target would be the 200 day MA which is currently at 1895. If it were to go there tomorrow (which we won’t) it would represent a 6.14% decline from the top – virtually the same move as the largest % move from January and February.
Could the market head down that far? Putting it another way, the low reached in August was around 7 S&P points from the current 200 day MA (which is moving higher). So a move to a level that was reached about 6 weeks ago is certainly not out of the question (nor would a 6.1% decline from the top be considered excessively bearish).
The only thing scary about going to the 200 day MA is that the price has not been below that moving average since November 2012. That is a long time ago. So a potential break might be scary in what it may trigger from a technical perspective. Let’s not worry about that though. There are closer hurdles to get below first.
Looking at the hourly chart below, the price fell below the 200 hour MA today (the yellow MA Line). It fell and stayed below the 50 and 100 hour MA yesterday (purple and green line). The last time it fell below all three was in the end of July and the fall took the price from 1971 to 1906.
The 200 hour MA is at the 1991.30 level currently. The 100 and 50 hour MA are at the 1997 area. Close risk can be defined against the 1991.30 where the 200 hour MA is found. Wider risk is the 1197.80 area where the 100 and 50 bar MA are found. If the bears are in control, the price should not go above this level. If it does, all bets are off. The bulls are back.
If it stays below the 1962 level is the 50% of the move up from August low and the next support target (see chart below).
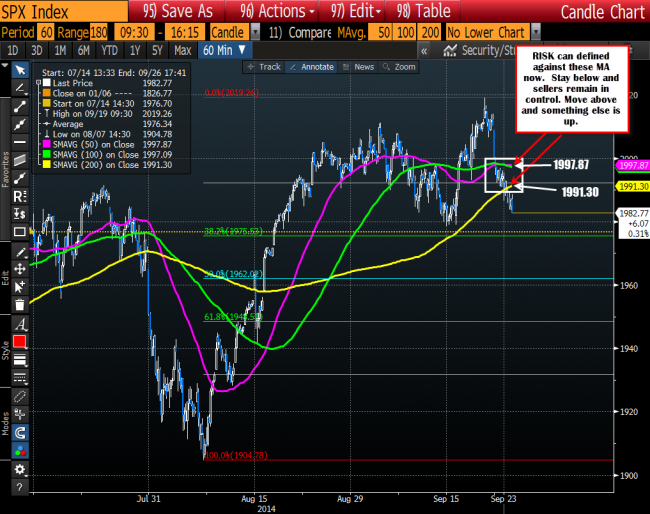
The price of the S&P is below the 50, 100 and 200 hour MAs now
The stock market tends to go up until sentiment changes and traders lighten up. Did the world change in the last 48 hours of trading? Not really. It does not have to. You know the story…”Momentum names get hammered”, “Market has not had a correction in a while
“2000 could to hold”, “China/EU are in trouble”. They will fit the story to fit the price. Add to it the irony that the index reached a peak on the Alibaba IPO date, when that stock moved up from $68 offering to a high of 99.70 on day one. What a better time to change sentiment, ignite some fear and correct.
Watch the 1991.-1997. If we get a little correction tomorrow, this area will be telling.

