
A few re=attempts at the topside have been knocked back and so it’s no surprise that we see USD/JPY having a look lower.
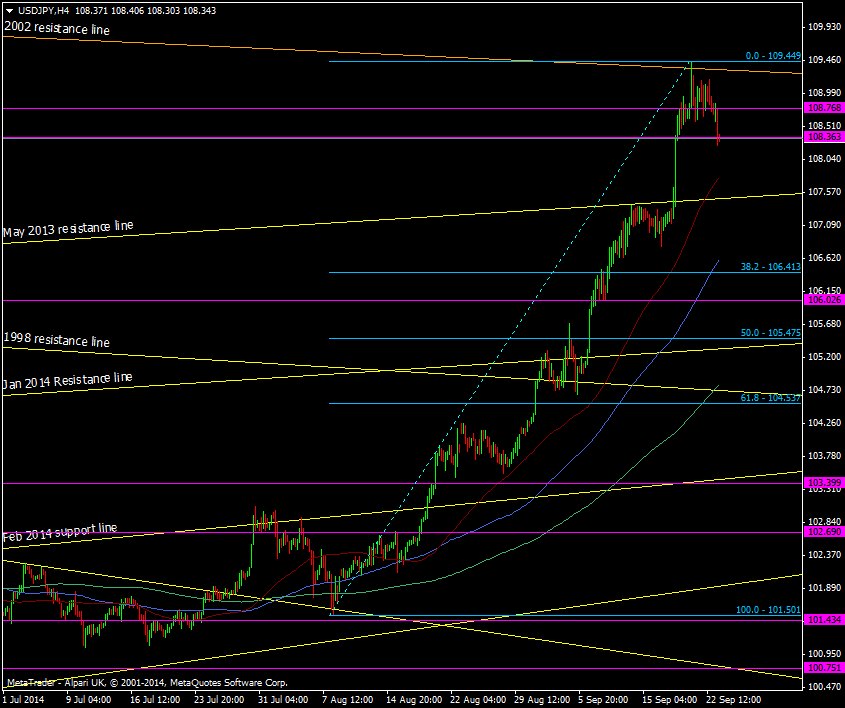
USD/JPY H4 chart 23 09 2014
Any big run up in a market is going to come to a halt at some point and I had the feeling last wee that we may indeed see a top put in place. The 2002 resistance line held, give or take a few pips, and further resistance is coming in just below it now as sellers look to protect shorts from the line.
We know the pair doesn’t mind going sideways for a while so we should be prepared for that to happen. At the moment 109.20/25 the 109.30/45 marks the top and I’ll be looking at the broken May 2013 trendline at 107.46 and former resistance at 107.36 as the spot for a short term bottom.
If we see the pair ping pong between then you have the range to play and if they break then go with the flow. All big rallies/sell off’s need a refresher now and again so don’t be surprised if the downside sees more action than the upside.

