
Whatever was blown at 1.2800 is now acting as resistance now as we’ve only managed a pip above it on two attempts. While the 61.8 fib of the 2012/2014 lo/hi was taken out too in the run to 1.2774, it’s seeing mild support again as we tread water for the moment between the two levels.
1.2750 is the next big support level before a near 100 pip drop to the Nov 2012 low at 1.2661. Under there it’s flushy flushy.
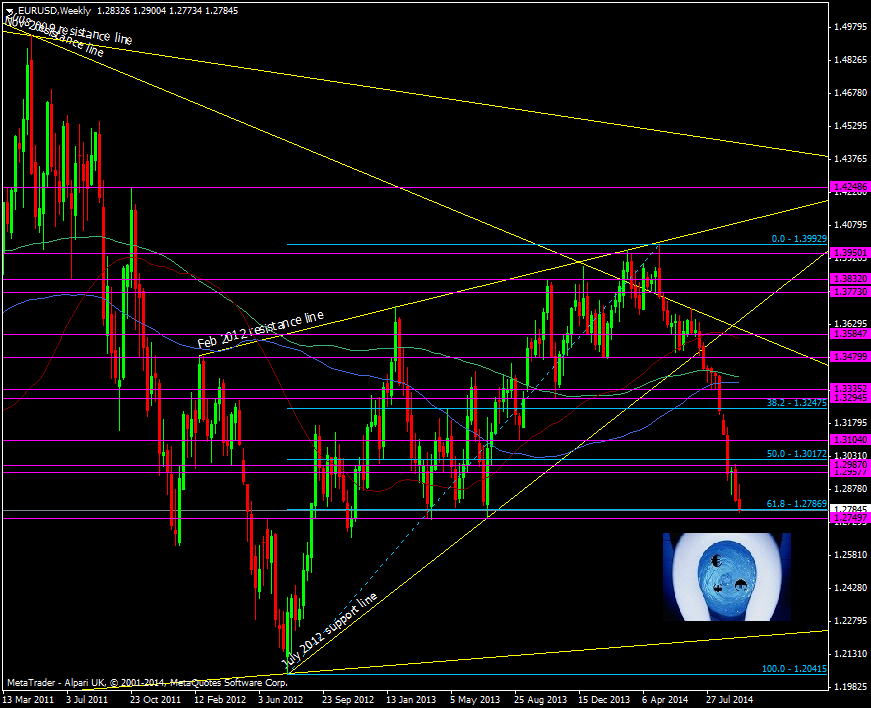
EUR/USD Weekly chart 24 09 2014
A move back into 1.2800 will see resistance at 1.2825/35 and pretty much every 10 pips to the highs at 1.2860

