
The USDJPY fell sharply down to a low of 108.51. The pair is now correction higher and testing the ever present 100 hour MA at the 108.858. The 38.2%-50% of the trend like move is also in this area. This is a sell area for bears. If the move lower is for real this is where sellers should show up. Don’t want to see a move much above the 1.08.94.
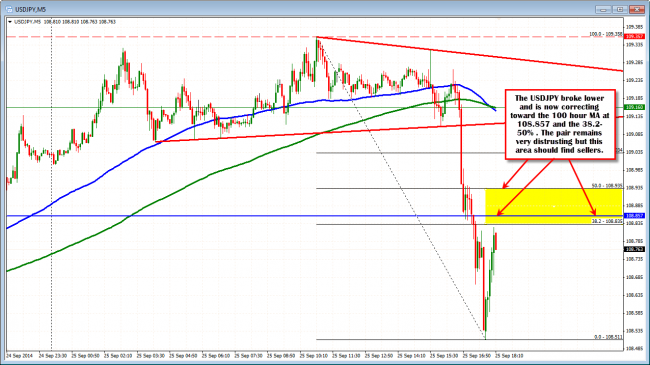
USDJPY corrects the fast move lower. Key test of the 100 hour MA and Correction Zone (yellow area).
The hourly chart below shows the up and down volatility this week. The red hours show the breaks below the 100 hour MA. The blue arrows show the breaks above. We just fell back below the 100 hour MA and are retesting that break. Can the sellers remain in control and the price finally move outside of this 6 day trading range? That is the trade. Eventually, the range will be broken. Will it be today? Short and watchin the aforementioned risk levels from the 5 minute chart and, YES, the 100 hour MA as well! Can it keep a lid on it? Risk is defined and limited. Targets below will ultimately need to be broken to give a distrusting market, some confidence.
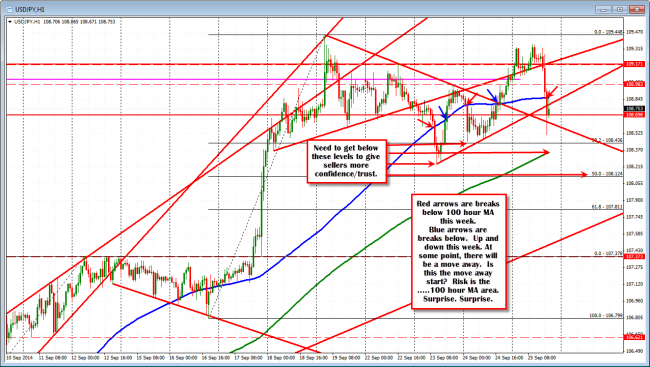
USDJPY hourly chart shows the distrust in the moves this week. At some point there will be a break away.

