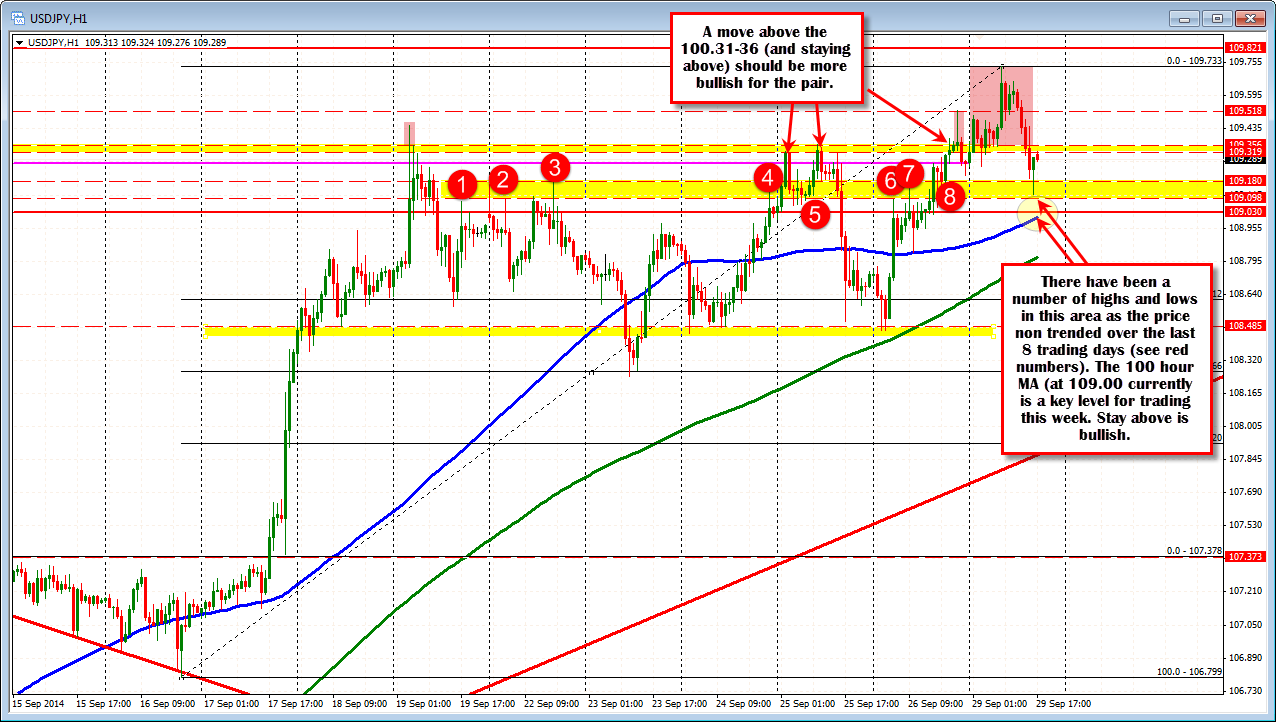
The USDJPY extended to yet new highs as it moved closer and closer to the next targets at the 110.00 (nice round number) and 110.65 (high price from 2008). The high extended up to 109.733 before rotating lower.
The price bottomed today against the lower boundary of lows and highs seen over the last 8 days of trading. Staying above the level is showing that the buyers are supporting the market against risk defining support.
The 100 hour MA (blue line in the chart above) comes in at the 109.00 level currently (and moving higher) and is also a level to lean against for buyers today (and in trading this week). The price in the non trending period over the last 8 trading days, has seen the price move above and below this area on a number of different occasions. Each break led to temporary momentum in the direction of the break (follow blue line in the chart above). However, that momentum faded and a reversal occurred.
Holding above this MA today and extending above and closing above the 109.31.-356 area might be the technical signal for traders to march higher and test the next targets at the 110.00 level and then the 2008 high at 110.65.
In the weekend video preview, the key trading levels to eye this week are outlined. The video can be found at the following link:


