
USD/CAD is another pair that lucked out ahead of its recent high and has fallen back to support.
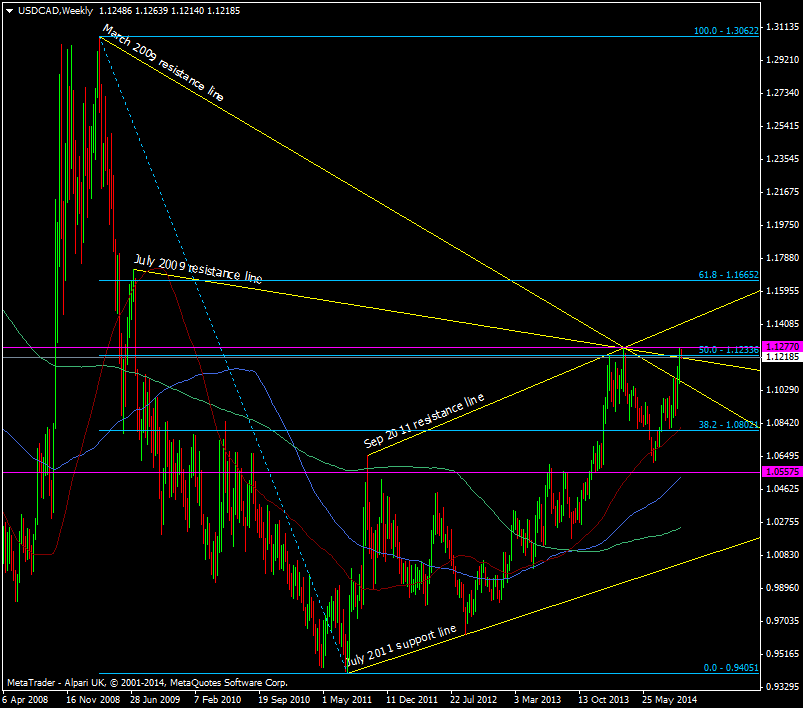
USD/CAD Weekly chart 06 10 2014
The 1.1270/80 level is proving a step too far and it’s been bolstered by a barrier at 1.1300. Taking a closer look we’ve found support on the broken July 2009 resistance line. The next line of support after 1.1200 is at 1.1175/80 when we had the spike through 1.1200
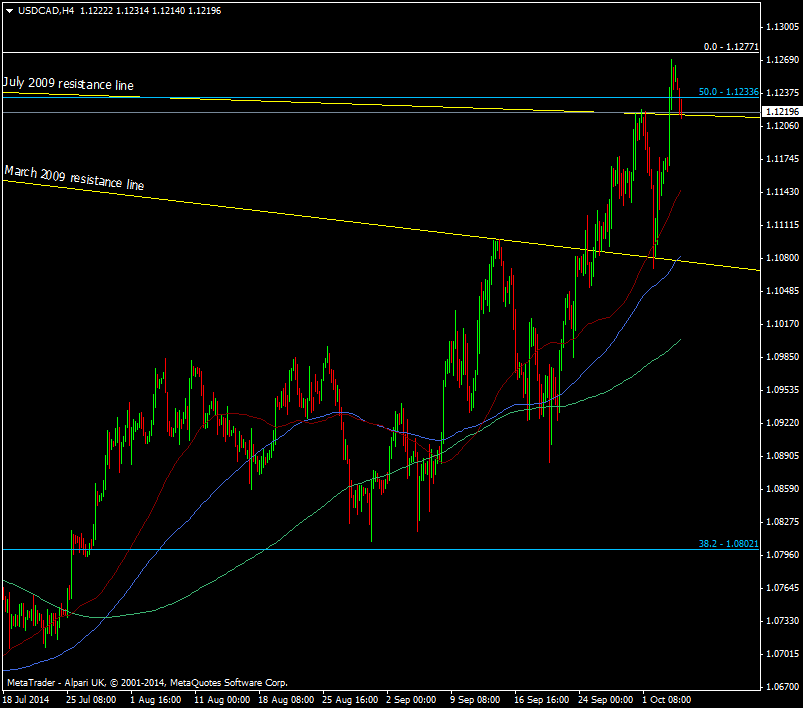
USD/CAD H4 chart 06 10 2014
If you check out the daily chart we’ve just had a golden cross down around 1.0935.
The only data today is from Canada and the Ivey PMI. Last month it took a big slip to 50.9 from 55.3 exp and July’s 54.1. This puts the indicator just above contraction. If you look at the chart for the Ivey on that link, you’ll see that the index historically doesn’t do to well over the summer. Maybe we’ll see a pick up this time around and if it’s strong that might be enough to kick the the pair lower through support. This month the market is expecting to see a rise to 53.0.

