
The USDJPY from a technical perspective has been in a non trending up and down range. There has been the push to the 110.00 level (high reached 1.10.07). There has been a move below what was a floor-ish area starting 108.485. Overall, as I see it, most of the trading is between 108.48 and 109.52 (or about 100 pips – see red box in the chart below). That is not a big range.
Today the price has wandered below the 108.48 level and the lower yellew extreme at 108.38 (see chart below). In other words, the price is testing the extreme area for the 3rd time. The test comes after the price held resistance earlier in the day against the 100 and 200 hour MAs (green and blue line in the hourly chart below – bearish signal). So perhaps the seller showed their stripes.
We have been here before and you can be sure the market will now want to see the price stay below the 108.485 (say 108.51 now RISK LEVEL). If the price can stay below this risk level, a test of the 108.00 level be eyed.
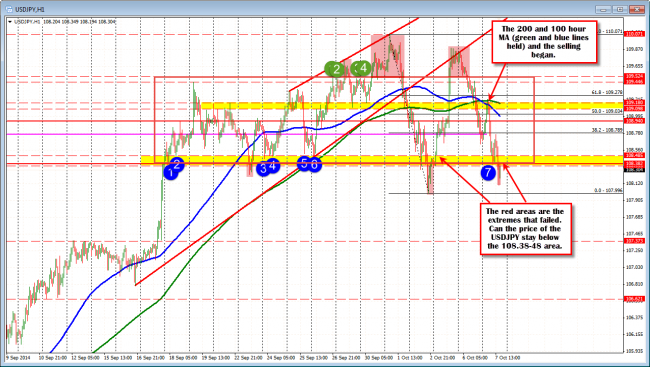
USDJPY testing the water in the extreme zone.
The next level after that comes in at 107.56 which is the underside of the broken trend line on the daily chart.
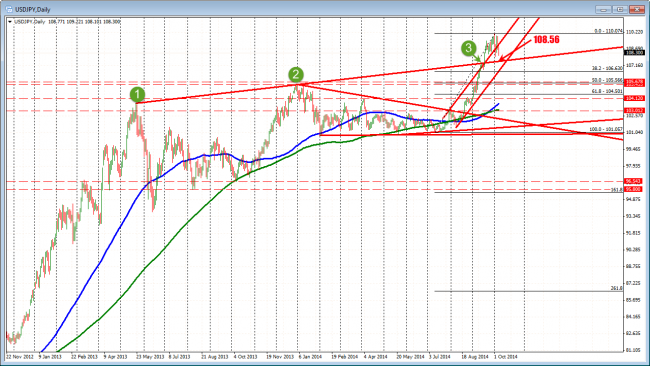
USDJPY daily chart has support from a technical perspective at 108.56

