
- GBP -3.079 bln prev revised up from -3.334 bln
- trade non-EU -GBP 3.587bln vs -4bln exp vs -4755bln prev revised down from -4.345bln
- visible trade balance (goods) GBP -9.099bln vs -9.6bln exp vs -10.414 bln prev revised down from -10.186bln
Better monthly figs but softer revisions for non-EU and visibles. I’ll see what the detail is and revert
Weaker imports a concern if it means household spending is being curbed
GBPUSD a tad higher at 1.6055 from 1.6047
Update: From the ONS
- Notably, this is the first time in the past five months that the trade in goods deficit has narrowed and although exports fell in August, imports fell more heavily.In detail, exports fell £0.7 billion to £23.2 billion, the lowest since September 2010. £0.6 billion of the decrease was attributed to a fall in oil exports and in particular, exports to countries outside of the EU. The second most significant fall was exports of chemicals; specifically medicinal and pharmaceutical products which fell £0.3 billion from the previous month.
Imports fell by £2.0 billion in August 2014; the largest monthly decrease since July 2006. Some weakness can be attributed to a return to typical levels following the increase in imports in July 2014, however, the fall mainly reflects a £1.1 billion decrease in imports of erratic items. Of the erratic items, aircraft and non-monetary gold are the most significant movements, accounting for more than half of the decrease. Although removing the effect of these erratic items raises the import level considerably, sizeable decreases in fuels (£0.6 billion) and chemicals (£0.3 billion) still have a substantial effect on the import market
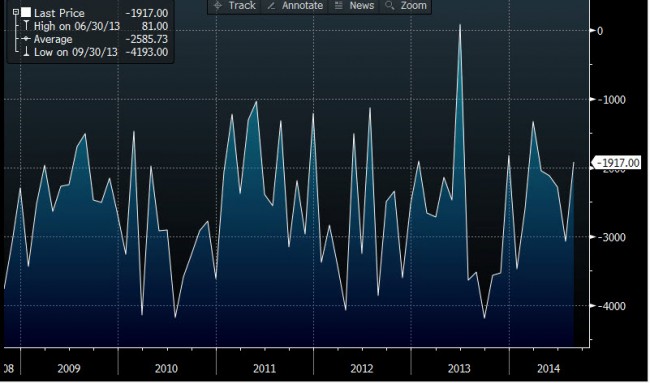
UK trade balance mm

